
Happy Friday, traders! Today, we are here with USDJPY market technical analysis and trading signals. Let’s dive into the analysis without delay.
USDJPY Technical Analysis and trading signals for Friday, June 28, 2024:
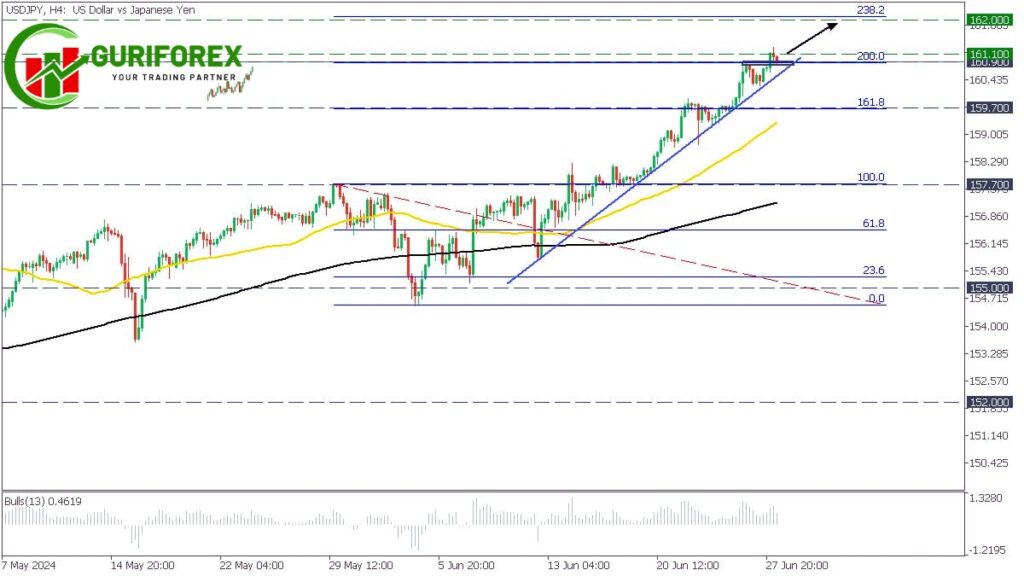
📈 On the H4 chart, USDJPY has continued its upward trend. It surpassed the 200.0 Fibonacci level before correcting. This pullback is common in a bullish market. It suggests that the pair might be preparing for another rally.
The Bulls Power Indicator, which measures the strength of the buyers, continues to show positive readings, reinforcing the bullish sentiment. Additionally, the moving averages are trending upwards, further indicating that the market is inclined to move higher. These technical signals suggest that there is a good potential for further gains in the USDJPY pair.
💹 Trade Idea: Given the current market conditions, a strategic entry point could be to buy USDJPY if it breaks above the 161.100 level. This breakout level serves as a confirmation that the upward momentum is resuming after the recent correction.
📍 Target Price (TP): Once the trade is initiated on the breakout above 161.100, the target price can be set at 162.000. This target is based on previous resistance levels and the potential continuation of the bullish trend.
In summary, the USDJPY pair has shown strong bullish behavior, supported by both the Bulls Power Indicator and moving averages. The current pullback to the trend line presents an opportunity for traders to enter the market on the next wave of upside momentum. A breakout above 161.100 could signal the resumption of the bullish trend, making it a viable entry point for buying the pair with a target price of 162.000.
🔍 We encourage you to review the analysis and consider this trading idea. If you agree with the technical outlook and the proposed trade setup, this could be a good opportunity to capitalize on the continued strength of the USDJPY pair. Let us know your thoughts and whether you find this analysis aligns with your market perspective.