
Greetings dear traders, Today we are here with Natural Gas (XNGUSD) Technical Analysis for You. Let’s delve into the Analysis without delay.
🔥 XNGUSD – Natural Gas Bulls Charging Up!
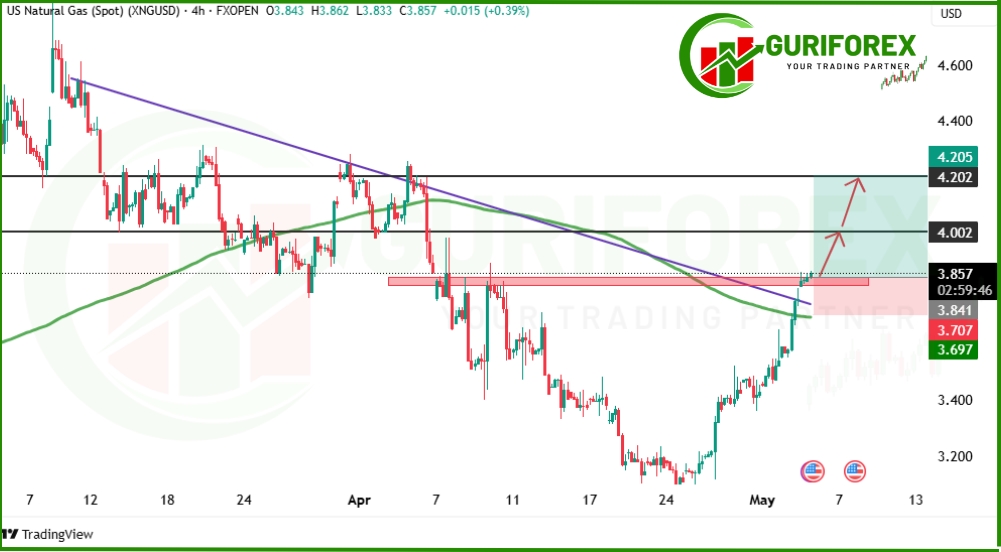
Natural Gas (XNGUSD) is showing signs of a bullish breakout as price rallies above the long-term descending trendline and the 200-period moving average (MA200). This breakout signals a potential shift in momentum from bearish to bullish, especially as geopolitical and fundamental factors begin to favor upside pressure.
📈 Fundamental Insight for XNGUSD
Geopolitical Support: The EU plans to phase out Russian natural gas imports by 2027. It also aims to end spot LNG deals by 2025. These moves are tightening future supply expectations. This long-term supply risk supports bullish sentiment in the natural gas markets.
China’s Return to the Market: China, a major LNG consumer, has resumed spot purchases after a long hiatus, paying around $10/mmbtu, which further strengthens demand-side dynamics.
These developments are pushing buyers back into the market, with Natural Gas potentially preparing for a strong rally in the near term.
📊 XNGUSD Technical Analysis
On the 4-hour chart, XNGUSD has:
Broken above both a major descending trendline and the MA200.
Retested the breakout area successfully (near 3.820).
Consolidated near a significant horizontal resistance and local fractal level, preparing for a continuation higher.
💡 Trade Plan for Natural Gas
🔼 Buy above: 3.820 (after consolidation and confirmation)
🎯 Target 1 (TP1): 4.000
🎯 Target 2 (TP2): 4.200
⛔ Stop Loss (SL): 3.700
A breakout and consolidation above the key level of 3.820 could trigger a bullish continuation to test $4.00 and possibly $4.20 in the coming sessions. Risk-reward remains favorable for bulls as long as the price stays above 3.700.
📢 Are you bullish on energy this week?
Smash ❤️ if you’re trading Natural Gas, and drop your target below! ⚡📈