
Happy Tuesday, Dear traders! Welcome to Guriforex.com. Today, we’re bringing you a technical analysis of the XAUUSD (Gold) market. Let’s dive right in!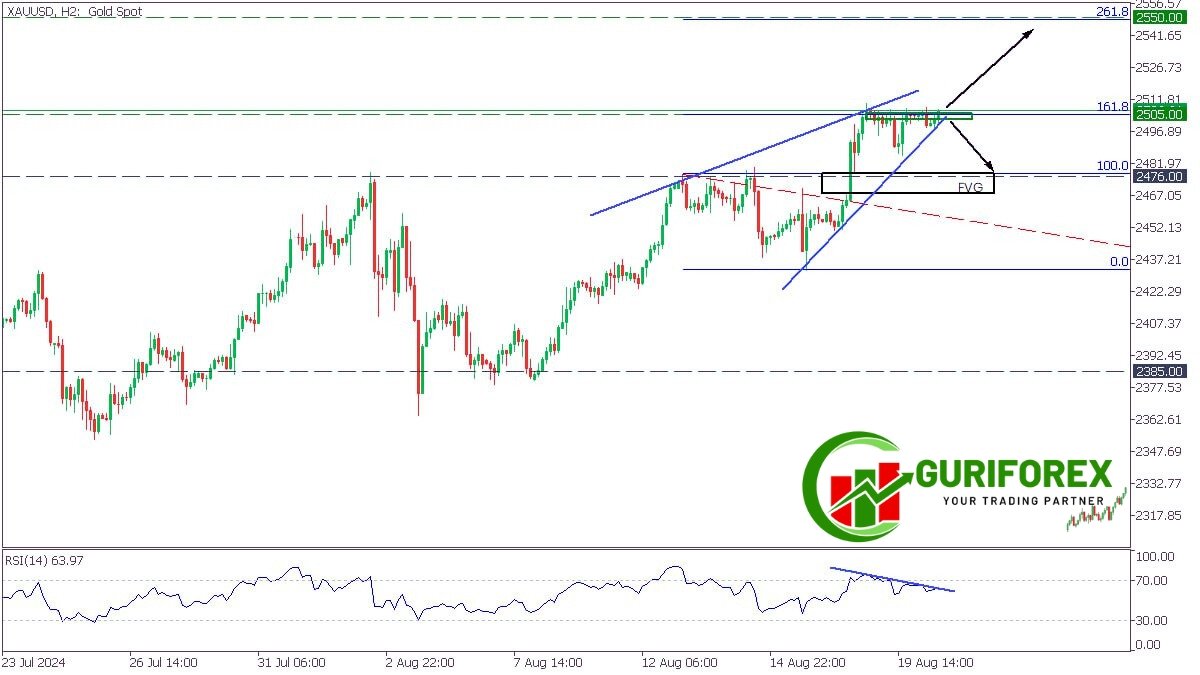
XAUUSD (Gold) Market Technical Analysis for August 20, 2024 by Guriforex:
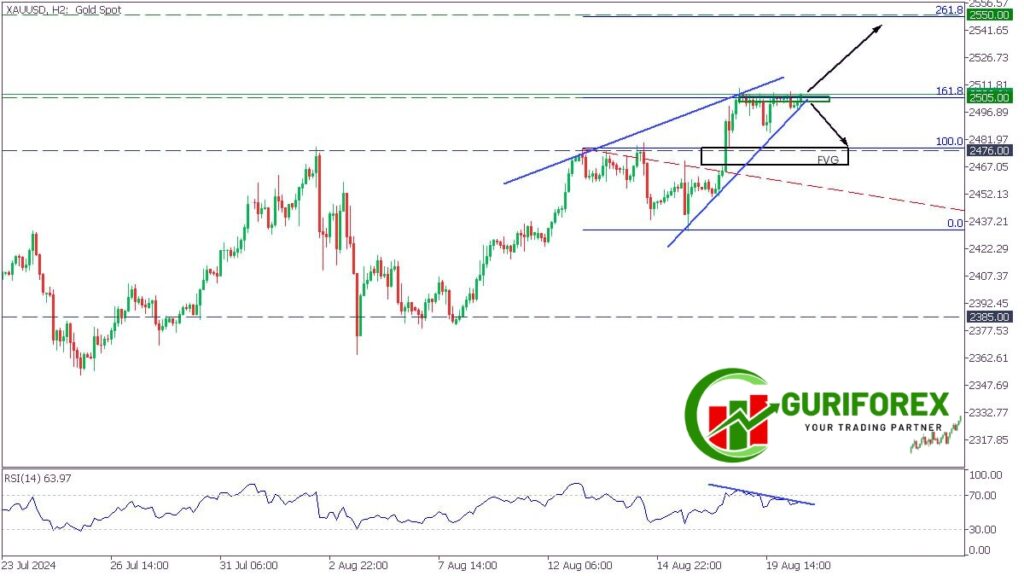
On the 2-hour chart (H2), XAUUSD (Gold) has shown impressive short-term growth, reaching a new historical maximum. This upward momentum has caught the attention of traders as the pair forms a rising wedge pattern, a structure that often signals a potential reversal. The price has now hit a critical resistance level at the 161.8 Fibonacci retracement, a key indicator in technical analysis.
📈 Technical Indicators at Play
- Rising Wedge Pattern: The formation of a rising wedge suggests that although gold has been increasing, the upward momentum may be waning. This pattern is often linked to potential bearish reversals, so traders should proceed with caution.
- RSI Divergence: Divergence on the Relative Strength Index (RSI) is forming. This indicates that while the price continues to rise, the underlying momentum might be weakening. This divergence is often a warning sign that a reversal could be imminent.
🚀 Key Levels to Watch
- Bullish Scenario: If XAUUSD the bulls manage to push the price above the 2505 resistance level, we could see a strong rally towards 2550, aligning with the 261.8 Fibonacci level. This would signal continued bullish strength and potential new highs for gold.
- Bearish Scenario: Conversely, if the XAUUSD price breaks below the lower trend line of the rising wedge, it could trigger a bearish scenario. The next key level to watch would be around 2476, where the price might find support near the Fair Value Gap (FVG).
💬 What’s Your Take?
- 📊 Bullish Outlook: Do you think XAUUSD (gold) will break above the 2505 level and continue its ascent? This could be an opportunity to ride the bullish wave.
- 📉 Bearish Outlook: Or do you believe the rising wedge and RSI divergence are signals that a pullback is on the horizon? A break below the trend line might present a chance to short.
🔔 Join the Discussion! Share your thoughts on this analysis in the comments below. Whether you’re bullish or bearish on gold, we’d love to hear your perspective! 📢