
Hello dear traders, today we present the XAUUSD (Gold) technical analysis and signals. Let’s delve into the analysis without delay.
XAUUSD Chart Breakdown: Bearish Momentum Builds Below 3310
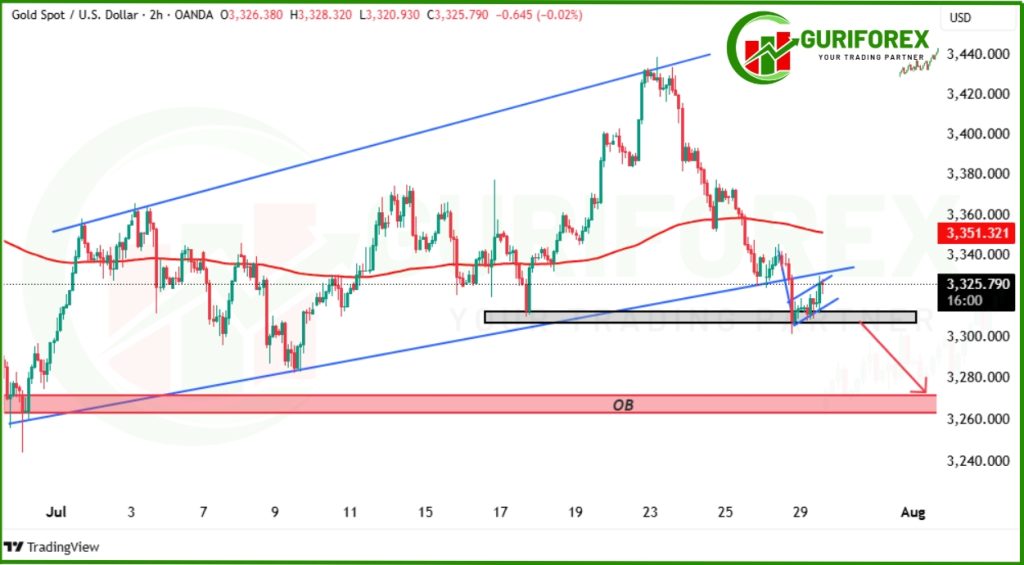
Gold (XAUUSD) continues to slide as bearish momentum takes control of the market. The XAUUSD chart now clearly reflects a shift in trend after the precious metal broke below the ascending channel trendline, signaling a major technical breakdown. Bulls are losing steam, and the bears are pressing their advantage.
On the 2-hour timeframe (H2), gold has formed a bearish flag pattern, which is typically a continuation structure within a downtrend. This flag follows the initial drop after the channel breakdown, and its presence further supports the case for another leg lower — provided the price confirms the pattern by breaking below its lower boundary.
Another key technical feature visible on the XAUUSD chart is the Order Block (OB) structure located just beneath the current price region. This OB zone might act as a short-term magnet for price before a potential continuation downward. Traders should also take note of a nearby fractal level, which — if broken — may accelerate the fall further.
🔽 Trade Setup Based on the XAUUSD Chart:
We are now only considering short positions in this scenario due to the clear bearish structure in place.
- Sell Condition: A confirmed consolidation below the 3310 level.
- Target 1: 3285 — this is a nearby support level and the first potential reaction zone.
- Target 2: 3265 — achievable if the price sustains pressure and consolidates below 3285.
Why XAUUSD Chart Setup Matters:
The current XAUUSD chart setup is a textbook example of trend reversal followed by a bearish continuation pattern. The break of the ascending channel and the development of a bearish flag indicate growing downside risk. This is further supported by fractal breakdown potential and the appearance of bearish order flow.
Traders should be cautious of false breakouts and wait for clear consolidation or price action confirmation below 3310 before entering a position. Tight stop-loss placement above the broken flag or 3310 level can help manage risk.
Sentiment Poll:
❤️ Destroy the like button if you agree gold is heading lower!
💬 Share your thoughts in the comments: Do you think the bearish momentum will take gold to 3265 this week?
Stay tuned with the Guriforex website and Facebook page for more XAUUSD chart analysis and timely trade ideas!