
Happy Tuesday, dear traders! We’re excited to bring you today’s in-depth technical analysis on the USDJPY market. Let’s dive straight into the charts and uncover the key levels and potential trading opportunities without further delay. Stay tuned for some valuable insights!
 USDJPY Technical Analysis and Trading Signal for September 3, 2024:
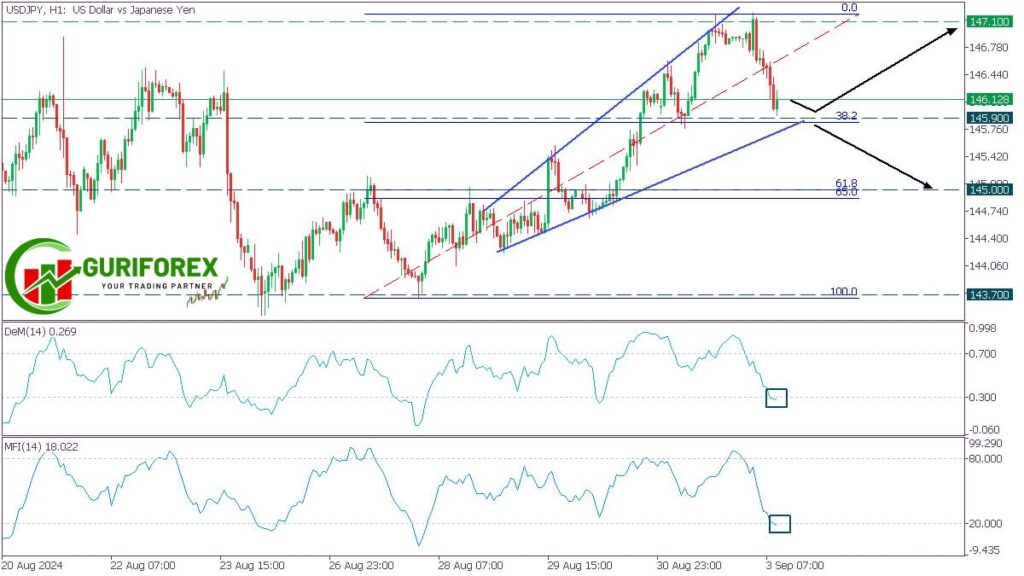
On the 1-hour chart (H1), USDJPY is navigating within an expanding channel, and the price is currently aiming to test the 145.90 support level, which aligns with the 38.2 Fibonacci retracement. This level is critical as it could determine the next direction for the pair. The DeMarker and Money Flow Index (MFI) oscillators are both indicate oversold conditions, suggesting that the pair may be primed for a bullish reversal.
📉 Key Technical Indicators
- Expanding Channel: This pattern suggests increased volatility, with the price swinging between higher highs and lower lows. The current move towards the 145.90 support is pivotal, as a rebound here could confirm the channel’s lower boundary.
- DeMarker & MFI Oscillators: Both indicators are signaling that the asset is in oversold territory. This condition often precedes a reversal, suggesting that the bulls may soon regain control.
🔍 Trading Strategy
- Bullish Scenario: If the price rebounds from the 145.90 support, which coincides with the 38.2 Fibonacci retracement, the next target would be 147.10. This level could offer a solid profit-taking point for those looking to trade the potential reversal.
- Bearish Scenario: However, if the price breaches below the 145.90 support, the next key level to watch would be 145.00. A drop to this level could signal further bearish momentum and a continuation of the downtrend.
💬 Your Thoughts and Strategy?
- Do you see the oversold conditions as a sign that a bullish reversal is imminent? Will you be buying USDJPY on a bounce from the 145.90 support?
- Or do you think the pair might break below this support, leading to further declines?
Share your thoughts about this analysis in the comments 💬 below, and let us know your trading strategy! Whether you’re anticipating a rebound or a breakdown, your insights can provide valuable perspectives for the trading community! 📊