Happy Wednesday, traders! Today, we’re here with market technical analysis and trading signals for US500. Let’s dive into the analysis without delay.

US500 Technical Analysis on H4 chart by Guriforex for September 4, 2024:
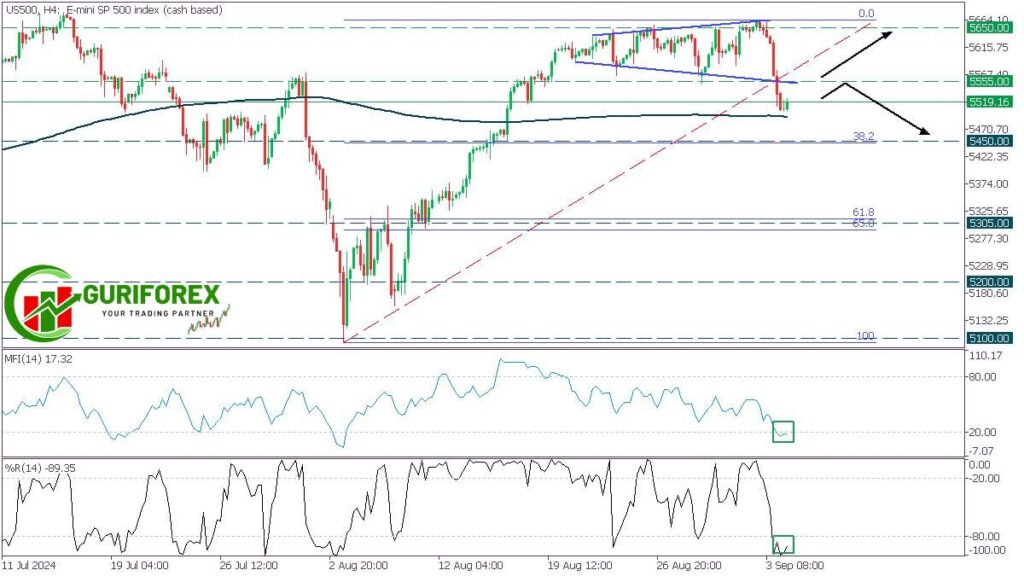
On the 4-hour chart (H4)📊, the US500 (S&P 500) has been moving within an expanding triangle pattern, but recently, it breached below the lower border of this formation. This break is significant as it could signal the start of a bearish correction. The Money Flow Index (MFI) and the Williams %R oscillator are both in the oversold zone, reinforcing the possibility of continued downward pressure. However, the 200-period Moving Average (MA) is providing an additional layer of support, which could halt or slow the decline.
📉 Technical Insights
- Expanding Triangle Pattern: This pattern, characterized by increasing volatility, has now seen the US500 breach below its lower boundary. This could be a bearish signal, but the market’s reaction to this break will be crucial in determining the next move.
- MFI and %R Oscillator: Both indicators are currently oversold, which often suggests that the selling pressure might be overextended. This could either lead to a bounce or signal that further downside is possible if the oversold condition persists.
- 200-MA Support: The 200-period Moving Average is a critical support level to watch. If the price stays above this MA, it might prevent further declines and could even facilitate a recovery.
🔍 Key Levels to Monitor
- Bullish Scenario: If the US500 can surpass the 5555 resistance level, it may rise further, targeting the 5650 level. This move would indicate that the bulls have regained control and are pushing the index higher.
- Bearish Scenario: On the other hand, if the US500 rebounds from the lower border of the expanding triangle and fails to hold above the 200-MA, the price could fall to 5450, with the 38.2 Fibonacci level acting as a further support zone.
💬 What’s Your Strategy?
- Are you watching for a breakout above 5555 to go long, or do you expect the bearish correction to continue toward 5450?
- How do you plan to trade the US indices today?
Are you trading US indices today? Share your thoughts on this analysis in the comments below. Whether you’re bullish or bearish, your insights could help guide others in the trading community! 📈📉