
Hello Traders, USDCAD is knocking at a key level — will the bulls defend it or will sellers take over? Let’s dive into the analysis without delay.
🧠 USDCAD Technical Breakdown | USDCAD Trading Signal by Guriforex for June 26
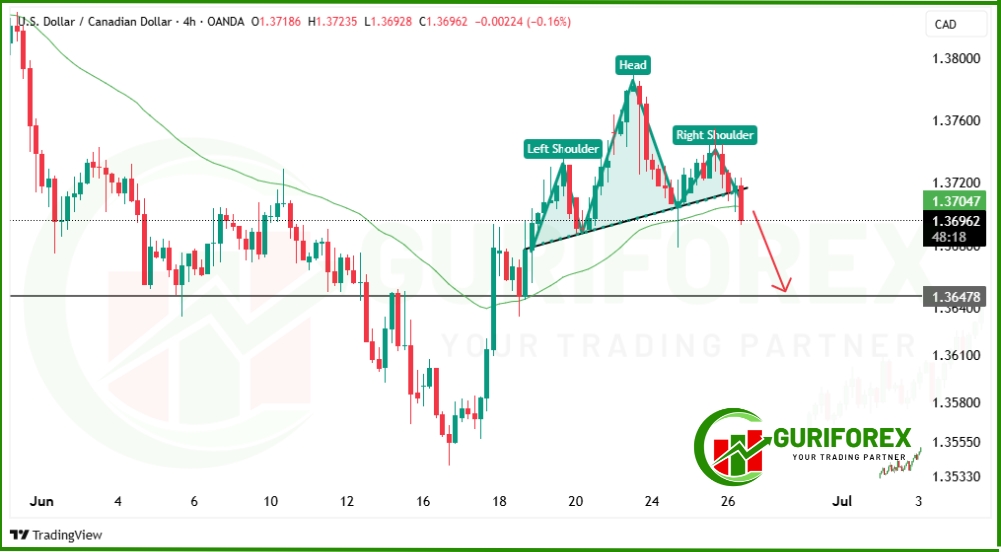
🔍 USDCAD is presenting a textbook Head and Shoulders pattern — a powerful signal often associated with trend reversals. This well-formed pattern is visible on the 4-hour chart, with clear symmetry between the left shoulder, head, and right shoulder. What’s even more interesting is the price action: the market has just retested the neckline, aligning with the 50-period moving average (MA50), which is acting as dynamic resistance.
This confluence gives us a strong case for bearish continuation, especially if price action decisively breaks below the 1.3700 neckline. If that happens, we may see renewed selling pressure as technical traders and algorithms trigger short positions en masse.
Why This USDCAD Setup Matters:
Head and Shoulders patterns are one of the most reliable reversal formations. In this case, it follows a bullish rally, which may now be losing steam. The right shoulder rejection, coupled with a rejection at MA50, confirms weakening bullish momentum.
Additionally, Canadian Dollar strength is subtly supported by recent oil market stability and a less dovish Bank of Canada, giving further fundamental bias in favor of CAD appreciation.
📌 USDCAD Trade Idea
- 🔽 Sell below 1.3700 (neckline)
- 🎯 Take-Profit (TP): 1.3650
- 🛑 Stop-Loss (SL): Above 1.3730 (right shoulder high)
- ⏱ Timeframe: 4H
🗣 Final Words:
If the neckline breaks, we may not only hit 1.3650 but possibly go deeper. However, if bulls defend the neckline, we may witness some consolidation or even a fakeout — so watch the breakout confirmation closely.
💬 What’s your take on USDCAD?
❤️ Hit like if you’re planning to short the pair!