
Good day, dear traders. Today, we are here to provide a technical analysis of the AUDUSD market. Let’s dive into the analysis as soon as possible.
AUDUSD Technical Analysis on H4 Chart by Guriforex for August 26,2024:
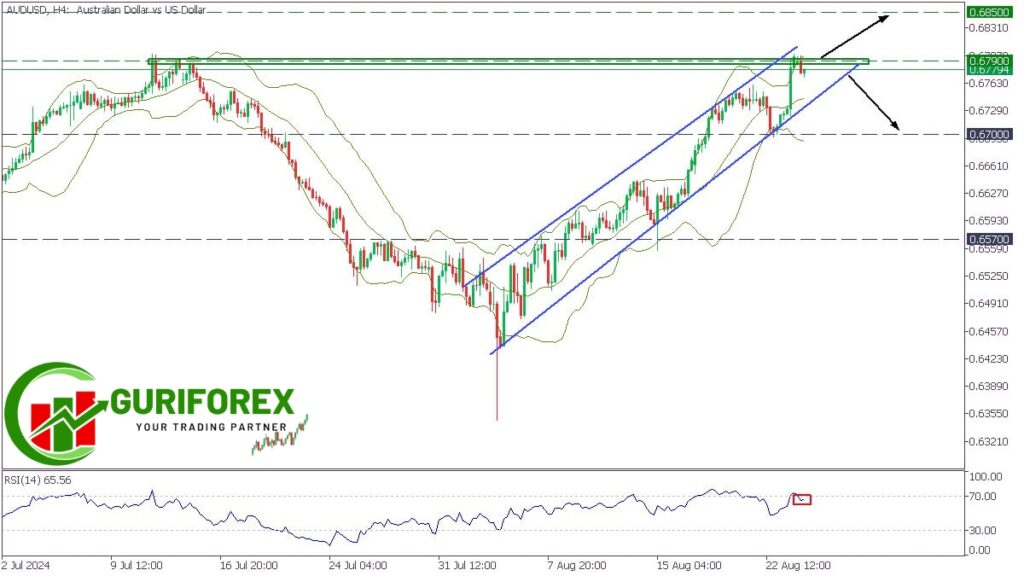
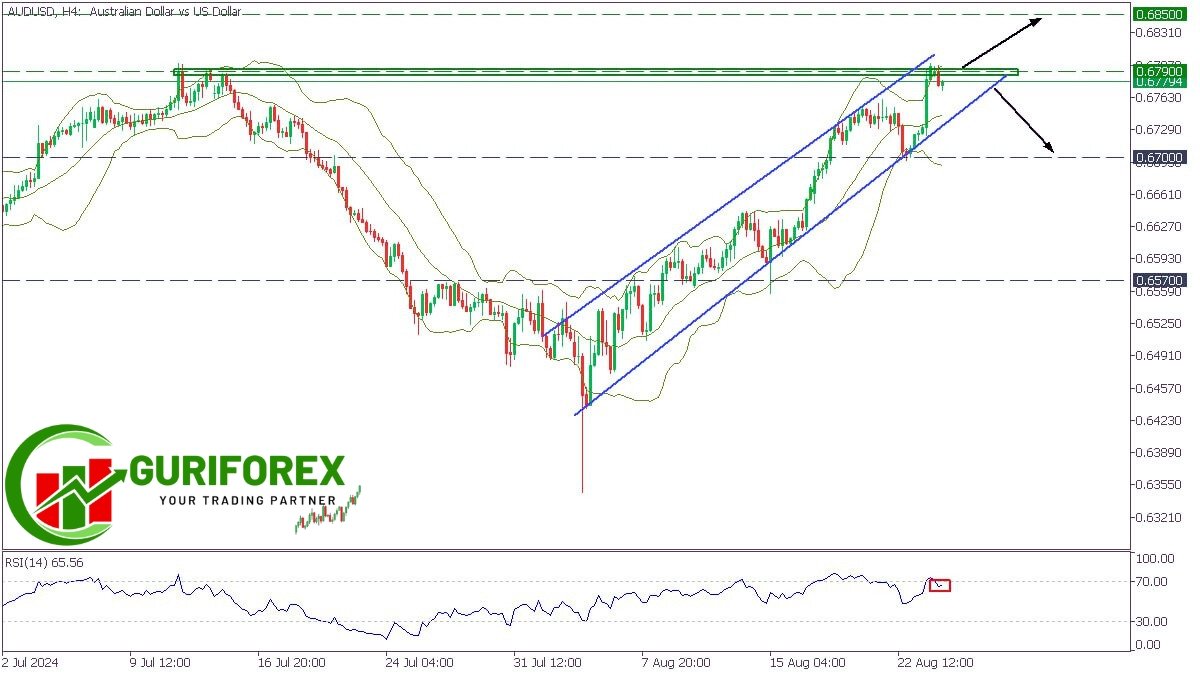
The AUDUSD pair is currently in a short-term bullish trend, forming an ascending channel pattern as it climbs higher. However, the pair has now reached a critical resistance area, raising questions about whether this upward momentum can continue. The price recently touched the upper Bollinger Band and has since bounced off, while the Relative Strength Index (RSI) has exited the overbought zone, suggesting a potential shift in market sentiment towards the bearish side.
📊 Technical Indicators to Watch:
- Ascending Channel Pattern: The formation of this ascending channel has guided the AUDUSD’s recent bullish trend. As long as the price remains within this channel, the bulls have the upper hand. However, with the price now testing the upper boundary, a breakout or breakdown could signal the next major move.
- Bollinger Bands: The touch and subsequent bounce off the upper Bollinger Band indicate that the pair might be encountering significant resistance. Bollinger Bands are often used to identify overbought or oversold conditions, and this bounce could be a sign that the bullish momentum is waning.
- RSI Oscillator: The RSI’s exit from the overbought zone is another bearish signal. This suggests that the recent buying pressure may be fading, and a correction could be on the horizon.
🔍 Key Levels to Watch:
- Bullish Scenario: If the bulls can push the price above the resistance at 0.6790, we could see the AUDUSD rise further, targeting the 0.6850 level. This would indicate that the bullish trend remains intact, and there’s room for more upside.
- Bearish Scenario: On the flip side, a break below the lower trend line of the ascending channel could trigger a decline towards 0.6700. This move would suggest a shift in momentum, with the bears potentially taking control.
💭 What’s Your Take?
- 📈 Bullish: Do you believe the AUDUSD will break through the resistance at 0.6790 and continue its upward trend?
- 📉 Bearish: Or do you see the recent signals as a precursor to a correction, with the pair heading towards 0.6700?
💬 Join the Discussion! Share your thoughts on this analysis in the comments below. Whether you’re bullish or bearish, your insights can help shape the conversation!