
Hey crypto traders! 👋
We’re back today with a fresh technical outlook on Bitcoin (BTCUSD) as it shows signs of strength after a significant bounce off the ascending trendline support. Let’s dive into the market structure and what could happen next…
💹 Bitcoin (BTCUSD) Analysis – Eyes on 110K After Trendline Bounce! 🚀
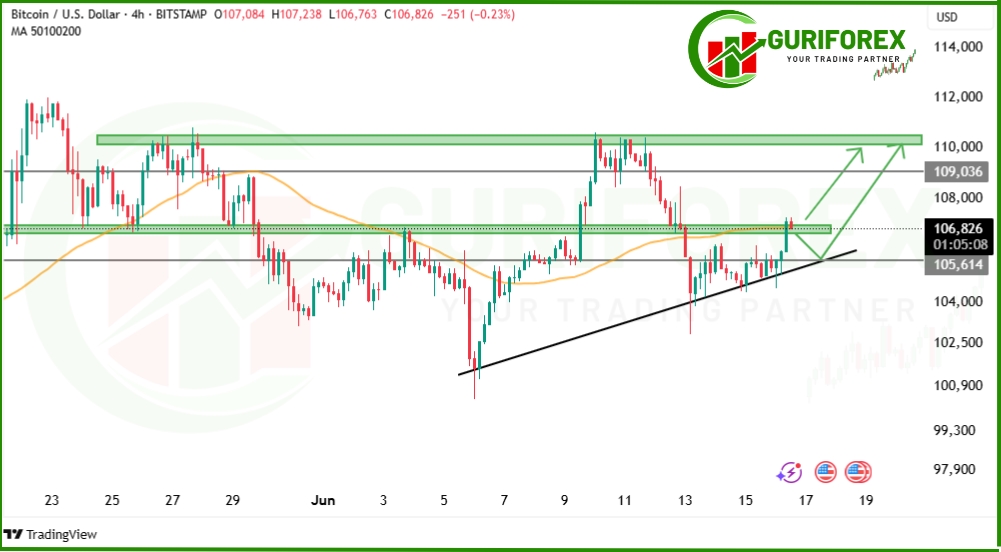
On the 4H chart, Bitcoin (BTCUSD) has once again respected its ascending trendline, a structure it’s been following for the past few sessions. The most recent price action shows BTC bouncing back above the 50-period moving average (MA50), which reinforces bullish sentiment in the short term.
More importantly, Bitcoin has now moved above a minor resistance zone and is hovering near $107,000, a critical level. If the price consolidates above this region, a push towards $109,000 and $110,000 becomes a highly probable scenario — both levels being liquidity targets from previous supply zones.
🧠 BTCUSD Technical Highlights:
- 🟢 Trendline support is holding strong.
- 🟢 Price is trading above MA50 — sign of regained momentum.
- 🟢 Liquidity resting at $109K–$110K offers a magnet for price action.
- ⚠️ A retest of the trendline near $105,600 is possible before continuation.
✅ Bitcoin Trade Setup
📌 Buy BTC/USD if the price consolidates above 107,000
🎯 Target 1: $109,000
🎯 Target 2: $110,000
🛑 Suggested SL: Below $105,600 (trendline zone)
📢 Final Thoughts:
Bitcoin continues to follow its bullish market structure, and the current setup offers a decent risk-to-reward opportunity for short-term traders. If bulls hold $107,000, we might witness a quick run to $110K, especially with strong momentum returning.
📉 However, keep an eye on the ascending trendline — if price fails to hold above $105,600, a breakdown may shift the bias.
💬 What’s your take on BTC today? Drop your thoughts below!
#BTC #BTCUSD #CryptoAnalysis #BitcoinForecast #GuriForex #TrendlineTrading #CryptoSignals