
Happy Monday dear traders! Welcome to our latest XAUUSD analysis! Let’s dive into the current market dynamics and what they might mean for traders.

XAUUSD Technical Analysis and Trading Signals for May 15, 2024:
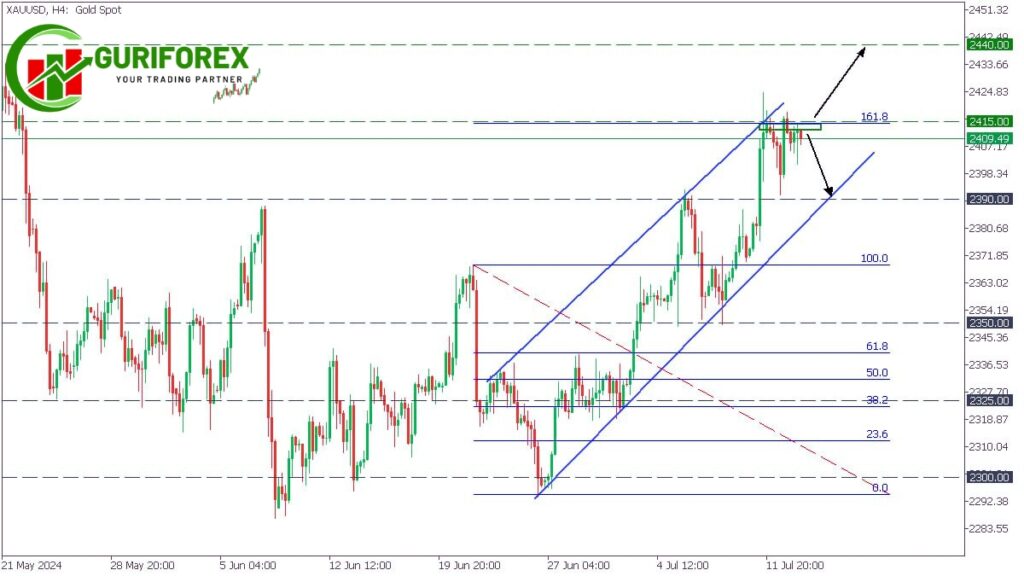
📈 On the H4 timeframe, XAUUSD has been forming an ascending channel pattern. The price has now reached a critical resistance level at the 161.8 Fibonacci retracement. Despite the overall bullish sentiment in the market, there is also a possibility that we might see a correction down to the lower trend line.
Key Levels to Watch
🔼 Bullish Scenario: If the bulls manage to push the price above the 2415 resistance level, we could see gold prices climb further to reach 2440. This upward movement would signify strong buying momentum and could present a profitable opportunity for traders looking to capitalize on the bullish trend.
🔽 Bearish Scenario: On the other hand, if XAUUSD faces resistance at the current level and fails to break above it, we might witness a pullback to the lower trend line around 2390. This potential correction could be an opportunity for sellers to enter the market, expecting the price to dip.
What This Means for Traders
📊 For those trading XAUUSD, it’s crucial to keep an eye on these key resistance and support levels. Ultimately, the market’s reaction at these points will likely dictate the next significant move for gold. Monitoring these levels can help traders make informed decisions on whether to enter or exit positions based on the market’s direction.
Your Action Plan
- 🔽 Selling XAUUSD: If you anticipate that the price will struggle to surpass the resistance and instead correct downwards, this could present an opportune moment to consider selling. Targeting the 2390 level specifically could prove to be a profitable strategy.
- 🔼 Buying XAUUSD: Conversely, if you are confident that the bullish momentum will continue and the price will break above 2415, buying at the current level with a target of 2440 could yield good returns.
Conclusion
Understanding the current market patterns and key levels is essential for making informed trading decisions. Keep an eye on the 2415 resistance and the 2390 support levels to navigate the XAUUSD market effectively.
Share your thoughts (agree or disagree) in the comments about this analysis.
Happy trading, and may the market be in your favor! 📈💰