
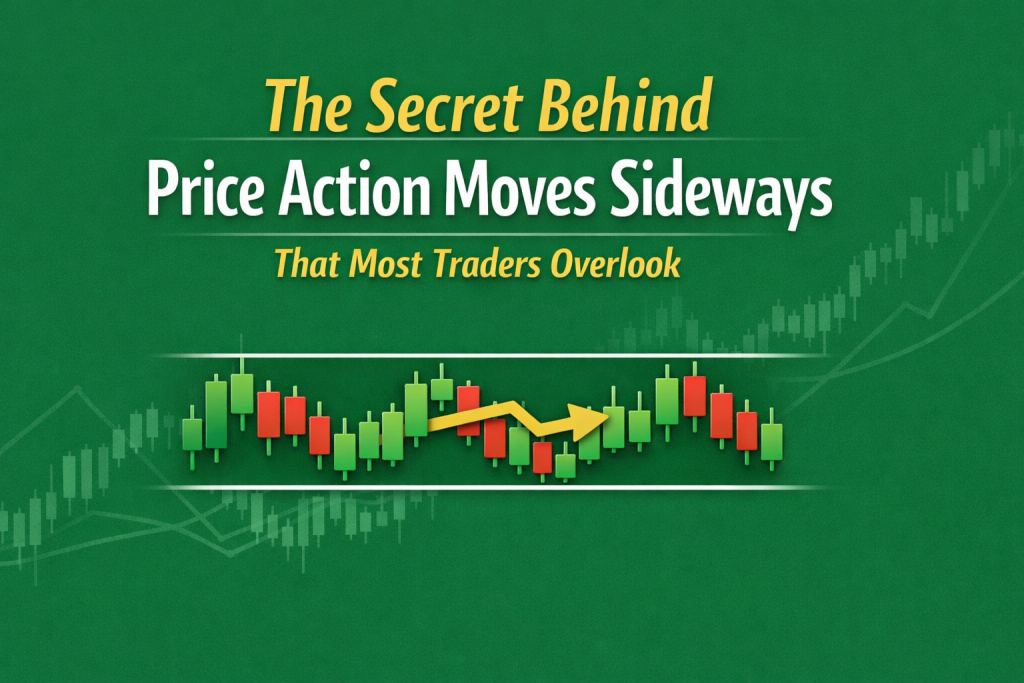
What Is It Called When Price Action Moves Sideways And Why Smart Traders Pay Attention
Most traders chase trends. Everyone looks for the next breakout or rally. But what if the market is not moving at all?
This is when beginners lose interest. But smart traders start paying attention.
Sideways price movement is not random or useless. Many high-probability trades start during these quiet phases. If you understand what happens when price stalls, you can see the market differently.
This guide explains it in a simple, practical way. No hype. No indicator overload. Just real price behavior from experience.
What a Sideways Market Really Means
A sideways market happens when price moves within a clear range, neither rising nor falling. The market takes a pause, volatility drops, and price stays within support and resistance levels.
In simple terms, buyers and sellers reach a temporary balance.
This phase is all about price action. You read the market by watching price itself, not relying on lagging indicators. When price moves sideways, it signals indecision rather than weakness.
Many traders assume the market is inactive during these times. In reality, the market is preparing for its next move.
Sideways movement usually appears:
- After a strong trend
- Before a major breakout
- During accumulation or distribution
If you overlook this phase, you might miss the reason behind major moves that come later.
This explanation aligns with how price action in trading is commonly described in established forex education resources, where market behavior is interpreted directly through price movement.
Understanding Price Action When the Market Stops Trending
Candlestick patterns change in sideways markets. Instead of long candles, you’ll notice:
- Smaller candle bodies
- Frequent wicks on both sides
- Rejections at the same price levels
This is the time when price action matters most.
Each rejection shows that one side tried to take control but didn’t succeed. These failed attempts help form a clear range. Price isn’t random; it’s testing where liquidity sits.
Experienced traders pay close attention to these signs. They don’t chase trades; instead, they observe:
- Which side is defending the range
- Where liquidity is building
- How price reacts at key levels
Sideways markets reward patience and punish impulsive trades.
Why Sideways Phases Matter in Price Action Trading
In price action trading, sideways markets aren’t a problem—they’re a signal.
Strong trends don’t appear out of nowhere. They build up during periods of compression. When price moves sideways for a while, orders accumulate and institutions quietly prepare.
That’s why you often see false breakouts. The market shakes out impatient traders before revealing its true direction.
If you look at any big market move, you’ll often notice a long period of consolidation before the breakout. Traders who understand this stop guessing and start preparing.
Sideways phases tell you:
- When not to trade aggressively
- When to reduce position size
- When to wait for confirmation
This mindset can help you avoid losses.
Key Price Action Patterns That Form in Sideways Markets
Some price action patterns show up often during ranging markets. These patterns help traders spot possible traps and future opportunities.
Common formations include:
- Range highs and range lows being tested multiple times
- False breakouts above resistance or below support
- Tight price compression before expansion
Classic reversal patterns like double tops and double bottoms often form within ranges. If you want a deeper look at how these patterns can trap retail traders, this guide explains it clearly.
These patterns are most meaningful in sideways markets. Outside of a range, they’re much less reliable.
Can a Price Action Indicator Help Identify Sideways Conditions
Many traders search for a price action indicator to spot when the market is ranging. While indicators can help, they should never take the place of price itself.
The main issue with most indicators is that they lag. By the time an indicator confirms consolidation, the move is often finished.
That said, indicators can help with:
- Volatility contraction confirmation
- Momentum weakness
- Avoiding overtrading
Smart traders use indicators as a secondary tool, not as the main decision-maker. Price always comes first.
Adding too many tools to your charts during sideways markets usually causes confusion instead of clarity.
What Is Price Action Trading When No Clear Trend Exists
So, what does price action trading look like when the market isn’t trending?
It’s about trading based on reactions, not predictions.
In sideways conditions, traders shift their mindset:
- Buy near support, sell near resistance
- Reduce expectations
- Focus on risk control
This isn’t about chasing big moves. It’s about being consistent and disciplined.
Many professional traders actually trade less during these phases, and that’s a skill on its own. Knowing when not to trade is just as important as knowing when to enter.
The Hidden Signals That Reveal When Sideways Markets Are About to Explode
Strong trends almost never start without warning. Successful price action trading often begins by spotting when a range is about to end.
Early clues include:
- Failed breakouts on one side
- Strong rejection candles
- Increasing volume near range boundaries
Sideways markets work like a spring: the longer the compression, the stronger the move that follows.
Traders who understand this don’t chase breakouts blindly. They wait for confirmation and enter with context, not just hope.
The Biggest Mistakes Beginners Make in Sideways Markets
Sideways markets expose weak discipline.
The most common mistakes include:
- Overtrading due to boredom
- Entering trades without confirmation
- Using trend strategies in non-trending conditions
Another big mistake is ignoring reversal signals. Patterns like the hanging man often show up near range highs and warn of possible reversals. If you want to see how this works on real charts, this breakdown is worth reading.
Most losses in sideways markets aren’t caused by the market itself—they’re caused by impatience.
Tools and Platforms Matter More Than You Think
Sideways markets require precision. Clean charts, quick execution, and stable platforms really make a difference.
Platforms like MetaTrader 4 remain popular because of their simplicity and reliability, especially when trading ranges and key levels. If you’re still making avoidable mistakes with execution or chart setup, this guide can help.
Good tools won’t guarantee profits, but bad tools can definitely lead to losses.
What Experienced Traders Do Differently
Professional traders don’t fight the market.
During sideways phases, they:
- Observe more than they trade
- Mark levels instead of guessing direction
- Wait for price to reveal intent
This approach matches how institutional traders work. Large players need time to build positions, and sideways markets give them that opportunity.
Sideways Does Not Mean Useless
One of the biggest mindset shifts for traders is realizing that sideways markets aren’t pointless.
It means:
- The market is neutral
- Risk is different, not absent
- Opportunity is forming quietly
Some of the best moves happen after long periods of boredom.
Final Thoughts From Real Trading Experience
Sideways price action isn’t a market mistake—it’s a message.
Traders who learn to read that message stop forcing trades and start thinking in terms of probabilities. They understand that patience isn’t passive—it’s strategic.
If there is one takeaway from this guide, it is this:
The market rewards those who wait for clarity, and sideways movement is often where that clarity starts.
If you master this phase, trends will no longer catch you off guard.
Disclaimer:
Trading involves risk. This article is for educational purposes only and is not financial advice. Always manage risk carefully and consult a licensed advisor before trading.
FAQs – Sideways Price Action Explained
What do traders call a sideways market in price action
Traders usually refer to sideways price movement as a range-bound market or consolidation phase, where price oscillates between support and resistance without forming a clear trend.
Is sideways price action good or bad for trading
Sideways price action is neither good nor bad by default. It depends on the trader’s strategy. For disciplined traders, it offers controlled risk and clear levels, while impatient traders often lose due to overtrading.
Why does price move sideways before a big breakout
Price often moves sideways because buyers and sellers reach temporary balance. During this phase, large players build positions quietly, which is why strong breakouts frequently originate from long consolidation zones.
Can beginners trade sideways markets successfully
Beginners can trade sideways markets, but only if they focus on simplicity, patience, and risk control. Most beginner losses happen when they apply trend strategies in non-trending conditions.
How can you identify a sideways market without indicators
A sideways market can be identified by repeated price rejection at the same highs and lows, smaller candle bodies, and lack of higher highs or lower lows — all visible directly on the price chart.
What mistakes should traders avoid during sideways price action
Common mistakes include overtrading due to boredom, entering without confirmation, and forcing trades when price is clearly stuck within a range.
Does sideways price action mean the market is weak
No. Sideways price action often indicates stability, not weakness. It usually reflects accumulation or distribution and often precedes strong directional moves.
How long can a sideways market last
A sideways market can last anywhere from a few hours to several weeks, depending on the timeframe and market conditions. The longer the consolidation, the more significant the eventual move tends to be.

2 thoughts on “The Secret Behind Price Action Moves Sideways That Most Traders Overlook”
Pingback: Bullish and Bearish Divergence: The Silent Market Signals Most Traders Never Notice
Pingback: How Many Trading Days Are in a Year? The Number Most Traders Misuse