
Inverse Head and Shoulders Pattern: The Hidden Bullish Reversal Behind Market Fear
Most traders look for new strategies and indicators, but they often miss the real move that starts a trend.
A reliable bullish reversal pattern often forms right in front of them. It works, but it does not look exciting.
The inverse head and shoulders pattern does not give obvious buy signals.
It forms slowly while most traders are still afraid or giving up.
By the time traders feel confident again, the price has already moved up.
If you’ve ever:
- entered a trade too late,
- fallen into a fake breakout, or
- watched a bullish trend start without you,
this guide will help you spot real market reversals.
Let’s break down how this pattern works, when it fails, and how you can use it to your advantage.
Why the Inverse Head and Shoulders Pattern Separates Winners from Chasers
Markets don’t move by accident.
Markets move because traders feel fear at the bottom and only gain confidence after the price moves. If you know why traders panic and hesitate, you can trust this pattern more.
The inverse head and shoulders pattern forms when sellers lose control, but buyers are not confident yet. This is when strong reversals start.
And that’s why this pattern matters.
This pattern matters because:
- It signals a true trend shift, not a temporary pullback
- It gives clear structure for entries, stop-losses, and profit targets
- It reveals the real fight between buyers and sellers, without indicator noise
There’s one question every trader asks at this point:
Is the inverse head and shoulders pattern bullish or bearish?
The answer is simple, but knowing why it works is what sets professionals apart.
We’ll uncover that next.
What Is the Inverse Head and Shoulders Pattern? (Simple, No Confusion)
The inverse head and shoulders pattern is a bullish reversal. It appears after a downtrend, when most traders expect prices to keep falling.
But then the market changes.
Selling pressure weakens. Buyers start to step in. The market shifts from panic to patient buying.
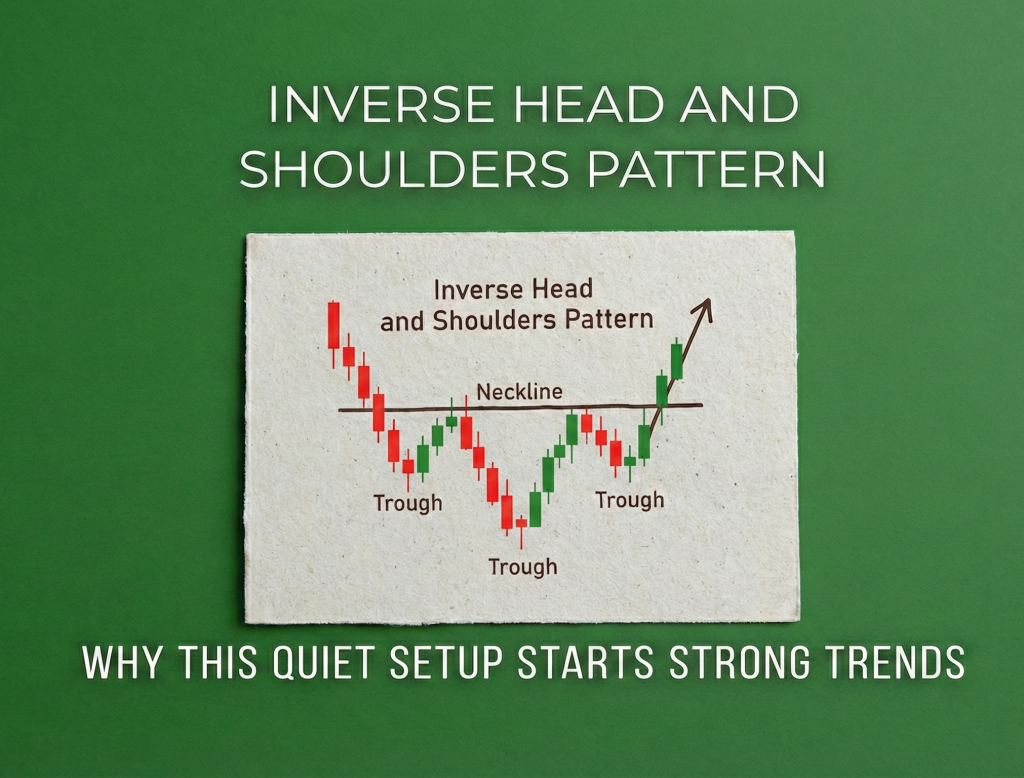
This pattern is built around three key lows:
- Left Shoulder – the first sign that sellers may be losing strength
- Head – the final panic low where fear peaks
- Right Shoulder – the moment sellers fail to push price lower again
These lows are connected by a resistance line called the neckline. This line shows if the reversal is real or a trap.
The traditional head and shoulders pattern warns of a bearish reversal. The inverse version signals the end of selling and the start of a new bullish trend.
Here is how it works:
- Sellers push price lower → but can’t maintain control
- Buyers absorb the selling → confidence slowly builds
- A neckline breakout → confirms the trend has shifted
This is why traders use the inverse head and shoulders reversal pattern. It marks when the market changes direction.
Structure of the Inverse Head and Shoulders Reversal Pattern
Knowing the structure helps you trade with control, not guesswork.
This pattern is not random. Each part shows who is winning between buyers and sellers.
1. Left Shoulder – The First Crack in Seller Control
Price makes a low during a downtrend and then bounces.
At this stage, sellers are still in control. But the bounce shows there is real demand below.
This is the first warning that selling may not last. Smart traders look for early clues, like a bullish harami candle, to spot when selling is getting weaker.
2. Head – The Panic Low Where Fear Peaks
Price drops again, creating a lower low than the left shoulder.
This is where fear reaches its highest point.
Inexperienced traders panic and sell. Experienced traders start buying during this pressure.
This low is the base of the reversal.
3. Right Shoulder – The Silent Signal Most Traders Ignore
Price drops again, but does not make a new low.
This is a key moment.
It tells us:
- Sellers are running out of strength
- Buyers are stepping in earlier than before
The market is giving a signal that most traders miss.
4. Neckline – The Line That Decides Everything
The neckline connects the highs between the shoulders and the head on the chart.
This is the main decision line.
A breakout above the neckline completes the pattern and signals a possible trend change.
If there is no breakout:
- The pattern remains incomplete
- The risk of a false move stays high
If the neckline does not break, do not trade.
Is the Inverse Head and Shoulders Pattern Bullish or Bearish?
Many traders ask this question and often get it wrong.
The short answer is this:
The inverse head and shoulders pattern is bullish, but only after you get confirmation.
This is where most traders make mistakes.
Here’s what makes the pattern bullish:
- Lower lows stop forming
- Buying pressure starts to rise
- Market sentiment slowly shifts from fear to confidence
But there is a common trap.
Many traders think it is bullish too early and lose money.
Until the neckline breaks clearly:
- The pattern is only a possibility, not a signal
- The overall trend is still technically bearish
This is why professionals succeed where others fail.
They do not trade on hope. They wait for confirmation.
How to Identify the Inverse Head and Shoulders Pattern Without Fooling Yourself
Spotting this pattern is not about speed. It is about discipline and patience.
Most mistakes happen when traders see the pattern where it does not exist.
Best Timeframes for Reliable Signals
This pattern works best on larger timeframes.
- Most reliable on H1, H4, Daily, and higher timeframes
- Lower timeframes often create noise and false breakouts.
The higher the timeframe, the more reliable the pattern.
Key Rules to Spot the Pattern
Before calling it an inverse head and shoulders, make sure all of this is true:
- It forms after a clear downtrend
- The head is the lowest point on the chart
- The right shoulder is higher than the head
- The neckline is clean and clearly visible
If any of these are missing, do not trade.
Common Mistakes That Cost Traders Money
- Entering trades before the neckline breaks
- Ignoring volume during the breakout
- Forcing the pattern just to justify a trade
Follow this simple rule to avoid losses:
If you have to convince yourself it is a pattern, it probably is not.
You must be patient.
Inverse Head and Shoulders Pattern Target: How Far Can Price Really Go?
A big advantage of this pattern is:
You do not have to guess your profit target. The market shows it in advance.
This clarity is why professionals use this setup.
How to Calculate the Inverse Head and Shoulders Pattern Target
The process is simple and effective:
- Measure the vertical distance from the head to the neckline
- Project that same distance upward from the neckline breakout
This level is your target. It is based on market structure, not guesswork.
Conservative vs Aggressive Profit Targets
Traders manage profits in different ways.
- Conservative traders lock partial profits early to reduce risk
- Aggressive traders hold for the full projected target
Many experienced traders scale out. They secure profits as the trend continues.
How to Trade the Inverse Head and Shoulders Pattern Like a Professional
Trading this pattern is not about speed.
It is about being precise and waiting for confirmation.
High-Probability Entry Strategies
Experienced traders use two main entry methods:
- Safe Entry: Enter only after a clear neckline breakout and close above it
- Aggressive Entry: Enter on a pullback or retest of the neckline as support
Smart Stop-Loss Placement
- Below the right shoulder, where the pattern fails
- Or slightly below the neckline after a confirmed retest
The Critical Role of Volume
Volume tells you whether the breakout is real.
- Decrease during pattern formation, showing seller exhaustion
- Increase sharply on the neckline breakout, confirming buyer commitment
- Volume during breakouts often decides if a reversal works. This guide explains why it matters.
Failed Inverse Head and Shoulders Pattern: Why Even Good Setups Collapse
False breakouts are a common reason traders lose money. Understanding them helps you avoid failed setups.
How a Pattern Fails
- Price breaks the neckline briefly
- Fails to hold above it
- Drops back below key support
Common Reasons for Failure
- Weak or nonexistent volume during breakout
- Strong higher-timeframe resistance blocking upward movement
- Fundamental news turning the market against the trend
Early Warning Signs You Can Spot
- Long wicks forming above the neckline
- Immediate rejection after breakout
- No follow-through momentum to confirm buyers are in control
Inverse Head and Shoulders Pattern vs Other Bullish Reversal Patterns
Vs Double Bottom
- Inverse H&S is more structured
- Offers clearer stop-loss levels
Vs Falling Wedge
- Wedges rely more on trendlines
- Inverse H&S relies on market psychology
Not every breakout leads to higher prices. Some patterns, like the rising wedge, can signal the opposite and trap traders.
Best Indicators to Confirm the Inverse Head and Shoulders Pattern
- RSI – Bullish divergence during head formation
- Moving Averages – Price breaking above 50 or 200 MA
- Volume – Strong breakout
Real Trading Examples of the Inverse Head and Shoulders Pattern
- Forex Example: EUR/USD forms inverse head and shoulders on H4 after downtrend → Neckline breaks → retest → strong bullish rally
- Crypto Example: Bitcoin forms inverse H&S during accumulation phase → Breakout confirms reversal → trend expansion follows
- Stock Example: A beaten-down stock forms inverse H&S near major support → Institutional buying pushes price higher after breakout
Key Trading Rules to Remember Before Using This Pattern
- Never trade without confirmation
- Risk no more than 1–2% per trade
- Wait for clean structure
- Combine with trend context
Final Verdict: Can You Trust the Inverse Head and Shoulders Pattern?
Yes, but do not trust it blindly.
The inverse head and shoulders pattern is one of the most reliable bullish reversal setups when used correctly.
It works best when:
- Formed after a clear downtrend
- The neckline breaks with strong volume
- Risk is properly managed
Avoid chasing it when:
- Market is ranging
- Breakout lacks momentum
- Higher timeframe trend contradicts the setup
Mastering this pattern will not make you rich overnight. But it will improve your discipline, and discipline is the key to long-term trading success.
Disclaimer:
Trading involves significant risk. This article is for educational purposes only and is not financial advice. Always use proper risk management and consult a licensed professional before making any trading decisions.
Quick FAQs Traders Are Searching For
Is inverse head and shoulders pattern always bullish?
It is bullish only after neckline breakout and confirmation.
Can the inverse head and shoulders pattern fail?
Yes. Failed inverse head and shoulders patterns happen due to weak breakouts or strong resistance.
What timeframe is best for inverse head and shoulders pattern?
H1, H4, and Daily timeframes offer higher reliability.
How accurate is the inverse head and shoulders reversal pattern?
When combined with volume and trend context, it’s among the most reliable reversal patterns.


2 thoughts on “Inverse Head and Shoulders Pattern Why This Quiet Setup Starts Strong Trends”
Pingback: Hammer & Inverted Hammer Candlestick: The Reversal Clue Hidden Inside These Candles
Pingback: Hanging Man Pattern The Silent Signal Smart Traders Never Ignore