
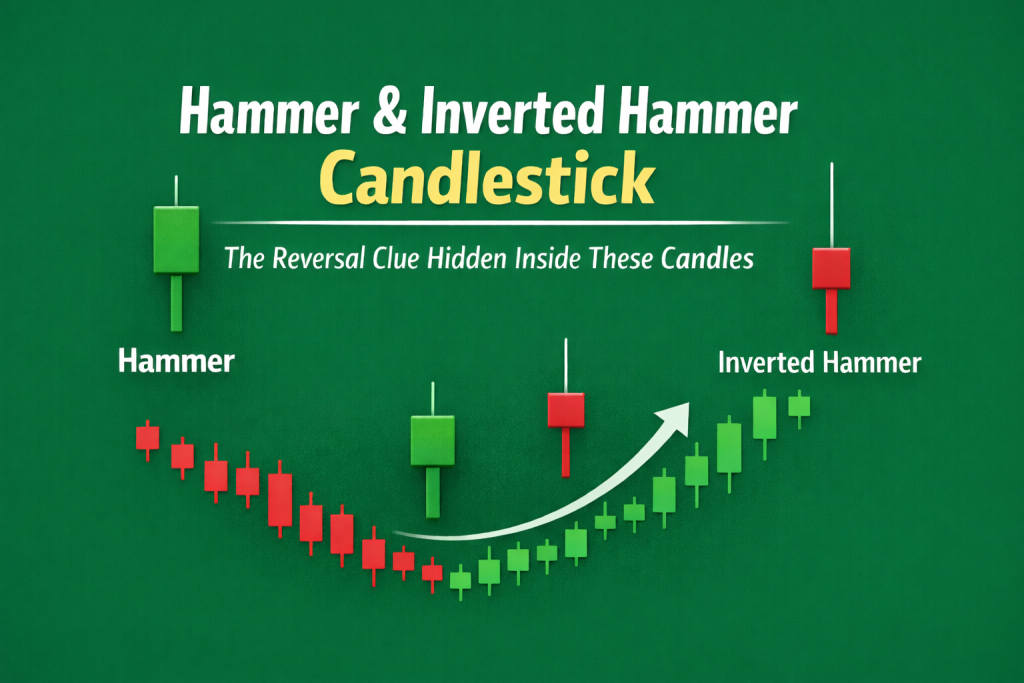
Hammer & Inverted Hammer Candlestick: What Most Traders Miss About These Reversal Signals
Many traders lose money not because they lack tools, but because they misread price action. After checking thousands of charts in forex, stocks, and crypto, one pattern always stands out: the hammer candlestick. It is powerful, but often misunderstood.
Some traders see a hammer or inverted hammer and jump in right away. But price often keeps moving the same way. The issue is not the candle itself, but how it is read.
Experienced traders understand a critical truth:
“a single candle does not reverse a market; shifting market psychology does.“
This guide shows how hammer and inverted hammer candles work in real markets. It is based on real chart experience and proven trading rules, not just theory. You will learn when to trust these candles, when to ignore them, and how smart traders use them to read price with confidence.
What Is a Hammer Candlestick?
A hammer candlestick forms after a price drop and can signal that sellers are getting tired. It has a small body at the top and a long lower wick. This means buyers pushed the price back up before the candle closed. Still, smart traders always wait for confirmation before trading.
For a widely accepted technical definition and market context, this explanation aligns with how professional analysts describe hammer candlestick behavior.
What Is a Hammer Candlestick Pattern? (Explained by Market Behavior)
A hammer candlestick pattern shows up after a price drop. It can mean sellers are running out of steam, but it does not always mean a reversal. The candle looks like a hammer and has three main parts:
- A small real body near the candle’s
- A long lower shadow, often at least twice the body
- Little to no upper
This pattern shows a change in control. Sellers push the price down, but buyers step in near the bottom and push it back up. This means the market rejected lower prices.
For professionals, a hammer is not a buy signal by itself. It shows that order flow is changing. It only matters when you have confirmation, the right market context, and a clear risk plan.
Hammer Candlestick Meaning Explained Simply
The real meaning of a hammer candle is price rejection, not instant reversal. Price drops and tests lower levels, but buyers step in and push it back up before the close.
This often means sellers are getting weak, but buyers are not fully in control yet.
Professional traders interpret a hammer like this:
“Selling pressure is weakening, but buyers still need to prove commitment.”
That is why experienced traders never trade a hammer alone. Without confirmation, it is just information, not a trade signal.
Bullish vs Bearish Hammer Candles: Context Is Everything
A bullish hammer usually forms at the bottom of a downtrend. It can show that control is shifting from sellers to buyers. If it appears near strong support after heavy selling, it may be the start of a reversal.
But the same candle can mean something else if it forms in a different place.
If a hammer forms after a long rally or near resistance, it can act as a bearish signal. This means buyers could not push the price higher, even though there was a short-term rejection.
The market does not respond to candle names.
It reacts to order flow, where the candle forms, and how much liquidity is in the market.
Understanding the psychology behind candlestick patterns helps traders avoid mechanical mistakes and focus on market behavior instead of candle names.
Color Psychology in Hammer Candles
Candle color can show emotion, but it does not predict the future.
A green hammer candlestick shows that buyers managed to close the session above the open, often reflecting stronger confidence and momentum behind the rejection. This can slightly improve bullish bias when other conditions align.
A red hammer candlestick, however, still represents rejection of lower prices—but with more hesitation from buyers. Sellers were unable to maintain control, yet buyers lacked dominance by the close.
Professional traders look at where the candle forms and its shape first. Color is just a bonus confirmation.
Bullish Hammer Candlestick Pattern: How Professionals Trade It
A bullish hammer is only worth trading if you get confirmation. Smart traders wait for proof that buyers are ready to step in.
Common confirmation criteria include:
- A strong bullish close above the hammer’s high
- Increased volume during the confirmation candle
- Confluence with key support or higher-timeframe structure
This careful approach helps you avoid false signals and stops you from trading on emotion.
If you use hammer strategies on MetaTrader, learn how to use the platform’s tools. This will help you confirm signals and manage risk better.
Hammer Candlestick Bullish Scenarios in Real Markets
When traders use hammer candles the right way, they often follow what big players are doing, not just retail traders’ emotions.
High-probability scenarios typically include:
- Pullbacks into established demand zones
- Reactions near key Fibonacci levels or moving averages
- Momentum divergence on indicators such as RSI or MACD
In these cases, the hammer is an early warning, not a signal to enter right away.
A good trade is based on confirmation, structure, and risk control, not just the candle.
In strong reversals, hammer candles often show up with other patterns that signal a trend change before the price really moves.
What Is an Inverted Hammer Candle?
An inverted hammer looks like a shooting star, but it forms after a downtrend. This can confuse traders, but what matters is where the candle appears.
An inverted hammer is defined by three key structural elements:
- A small real body positioned near the candle’s low
- A long upper shadow showing upward price rejection
- A minimal or nearly absent lower wick
An inverted hammer forms after a price drop and can signal a possible bullish reversal. Buyers push the price up during the session, but cannot keep control by the close.
This does not mean the signal is wrong. It just shows buyers are interested, but not yet strong.
Inverted Hammer Candlestick Formation and Market Psychology
The inverted hammer is often the first sign that market sentiment is changing. Buyers test higher prices, and sellers have to defend. Even if price falls back before the close, it shows sellers may be getting weaker.
Professional traders interpret this behavior cautiously:
“Sellers are losing momentum, but buyers haven’t fully taken control yet.”
Because buyers are not in control yet, confirmation is even more important with an inverted hammer than with a regular hammer.
What Does an Inverted Hammer Candle Mean?
It signals potential bullish intent, not a guaranteed reversal.
This candle often appears when:
- Sellers begin to lose momentum
- Buyers start probing resistance levels
- Smart money quietly tests liquidity above price
Without a strong bullish follow-through candle, the inverted hammer remains informational rather than actionable.
Inverted Hammer Candle Meaning in Downtrends
The true inverted hammer candle meaning depends entirely on where it forms within the broader trend.
When it appears after a sharp sell-off at a well-defined support zone, it may mark the early stages of accumulation and shifting control. In contrast, when it forms mid-range or near resistance, it frequently fails and traps early buyers.
This is why experienced traders focus on location, confirmation, and structure, while beginners focus only on the candle shape.
Context is what separates professionals from amateurs.
Inverted Hammer Candle Pattern: Bullish Signal or Fake Setup?
The inverted hammer can signal a bullish reversal, but only if strict conditions are met. By itself, it just shows buyers are interested, not in control.
This pattern works best when:
- It forms at a well-defined support level
- The following candle closes strongly bullish
- Volume confirms real market participation
If these things are missing, the inverted hammer often traps early buyers. Professionals see it as a warning, not a signal to enter.
The Role of Color: Inverted Green Hammer Candle
An inverted green hammer candle indicates that buyers managed to close the session above the open, adding slight strength to the bullish narrative. This can improve confidence when other technical factors already align.
But color alone does not matter if the structure is weak, the location is bad, or there is no confirmation. Big traders do not trade candle colors. They trade zones, liquidity, and order flow. Color is just extra evidence.
Upside Down Hammer Candlestick vs Similar Patterns
Many traders mix up the upside down hammer and the shooting star because they look alike. The real difference is where they form, not how they look.
- In a downtrend → the pattern may signal potential reversal
- In an uptrend → the same structure often signals distribution
The chart always shows who is in control. If you know the trend, you can turn a confusing candle into a useful signal.
Hammer vs Inverted Hammer: Key Differences Traders Must Know
Hammer and inverted hammer candles look similar, but they mean different things. Knowing the difference helps you avoid weak trades and find better setups.
| Feature | Hammer Candlestick | Inverted Hammer Candlestick |
| Wick Direction | Long lower wick | Long upper wick |
| Buyer Control | Buyers regain control late | Buyers attempt control early |
| Confirmation Need | Moderate | High |
| Failure Rate | Lower when well placed | Higher without confirmation |
If you know the difference, you can pick better trades and avoid mistaking early signs for real reversals.
Common Trading Mistakes With Hammer-Type Candles
Most losing trades with hammer candles happen because of simple mistakes, not bad luck. The most common errors are:
- Entering trades without confirmation
- Ignoring the higher-timeframe trend
- Trading hammers inside consolidation ranges
- Failing to define a stop-loss
Candlestick patterns reduce uncertainty, but they never eliminate risk. Discipline and structure determine long-term results. Traders who rely on a single candle often miss how multi-candle formations can provide clearer confirmation and reduce false reversal signals.
Professional Trading Rules for Candlestick Reliability
Experienced traders use a simple set of rules when trading with candlestick patterns:
- One candle never equals a complete trade setup
- Market structure outweighs indicators
- Risk is defined before entry, not after
- Losses are accepted as part of a profitable system
This way of thinking helps you trade with confidence and stay consistent for the long term.
Conclusion: How to Use Hammer and Inverted Hammer Candles Smarter
Hammer and inverted hammer candles are not magic signals. They are visual clues that the market might be changing.
When traded with:
- Proper market context
- Clear confirmation
- Defined risk management
- Emotional discipline
They become useful tools, not costly mistakes.
The real difference between losing and winning traders is not information. It is the skill to read price action with patience and care.
Disclaimer:
This article is for educational purposes only and does not constitute financial or trading advice. Trading involves risk, and candlestick patterns do not guarantee results. Always use proper risk management and consult a qualified professional before trading.
3 thoughts on “Hammer & Inverted Hammer Candlestick: The Reversal Clue Hidden Inside These Candles”
Pingback: Hanging Man Pattern The Silent Signal Smart Traders Never Ignore
Pingback: Bullish and Bearish Divergence: The Silent Market Signals Most Traders Never Notice
Pingback: Doji Candles Explained: The Quiet Signal Most Traders Get Wrong