
Why Double Top and Double Bottom Quietly Signal Major Market Reversals Before Everyone Else
Financial markets don’t usually make reversals obvious. Most big trend changes start quietly, while retail traders keep chasing breakouts that seem perfect on the chart, only to see them fail.
By the time most traders notice a change, experienced investors have already adjusted their positions, liquidity is gone, and momentum is fading.
During these quiet changes, two price patterns show up again and again: the double top and the double bottom.
When you understand them well, these patterns are more than just shapes on a chart. They show how traders think, how liquidity moves, and who is in control. This article explains how professionals read these patterns, why many traders get caught by them, and when you should really pay attention.
Why Most Traders Misread Reversal Patterns and Pay the Price
Most traders learn patterns by memorizing how they look, not by understanding how they work. They focus on the shape and forget to consider where, why, and under what conditions these patterns appear.
Retail traders commonly:
- Trade reversal patterns in the middle of ranges
- Ignore higher-timeframe trend direction
- Enter early without confirmation
- Expect instant reversals instead of gradual transitions
Professional traders see patterns as warnings, not as direct signals. They wait for proof that control has really changed before risking their money.
What Is Double Top and Double Bottom? The Structural Clue Most Traders Overlook
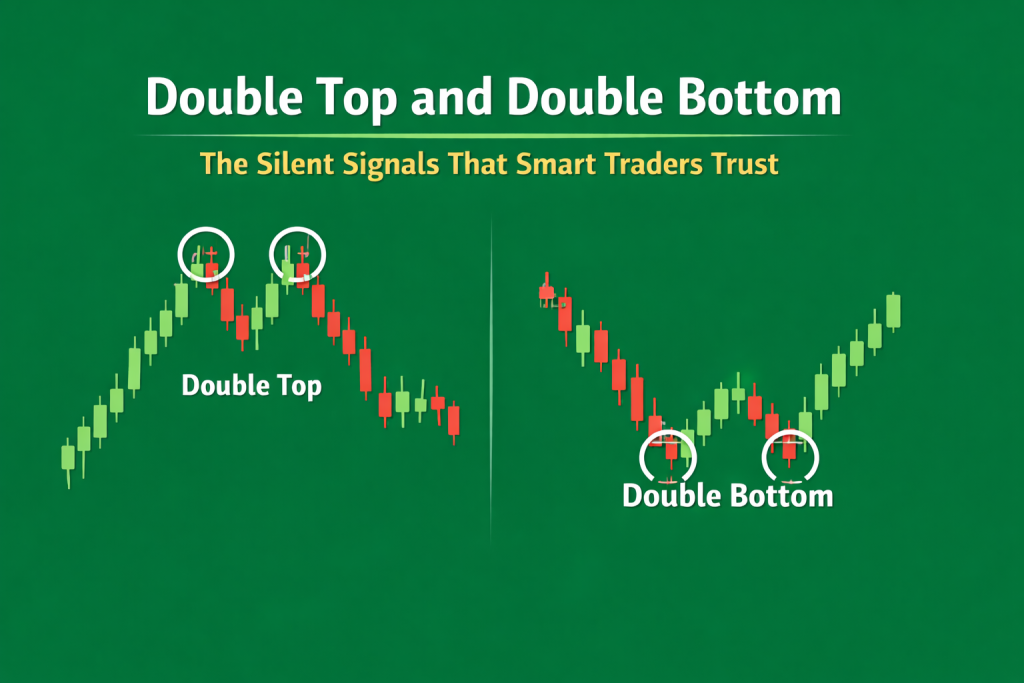
A double top happens when the price tries to go higher twice but can’t break through resistance, showing that buyers are losing strength. A double bottom is the opposite: the price tries to go lower twice but can’t break support, which means selling pressure is being absorbed instead of pushing prices down further.
In traditional technical analysis, these patterns are called reversal patterns. But professional traders care less about textbook definitions and more about how price reacts after the second test. They look for confirmation, whether key levels hold or break, and how liquidity behaves. This approach is also supported by trusted sources like Investopedia’s explanation of double top and double bottom patterns.
Double Top Explained: The Psychological Trap That Turns Breakouts Into Losses
A double top forms when the price tries to break a previous high but can’t find enough buyers to keep going. The first rejection is a warning, but the second attempt often tricks late traders into entering just as momentum is running out.
This second failure often leaves buyers stuck at bad prices, giving bigger traders a chance to sell or exit their positions. What looks like strength on the chart is often actually distribution.
What Does a Double Top Mean in Trading?
From a professional perspective, a double top signals a shift in market behavior, not an immediate reversal:
- Buyers are no longer willing to pay increasingly higher prices
- Sellers grow more confident defending resistance
- Liquidity above previous highs is being used, not respected
This pattern isn’t a signal to sell right away. It shows a transition, where the market is testing demand and starting to show weakness, not giving a clear prediction.
Traders who look for confirmation from just one candle often mix up this setup with other reversal signals like the Hanging Man pattern. These also need context and confirmation to work well.
Is Double Top Bullish or Bearish? Why the Answer Isn’t What Most Traders Expect
The real answer is simple: it depends on the context, not just the pattern itself.
In a strong uptrend on higher timeframes, a double top usually just causes a short pullback before the trend continues. But if it forms near major resistance or when the trend is running out of steam, it often means distribution instead of strength.
Professional traders do not label a double top as bullish or bearish without first evaluating:
- Trend maturity across higher timeframes
- Market reaction after the neckline is tested or broken
- Volume behavior during the second high and rejection
- Overall higher-timeframe structure and momentum
If you don’t use these filters, calling a double top bullish or bearish is just guessing, not real trading.
Double Bottom Explained: How Smart Money Accumulates While Fear Peaks
A double bottom isn’t just the opposite of a double top. In real markets, it often shows that bigger players are quietly buying after a lot of selling, especially when fear is high and weaker traders are leaving.
The first low usually happens during panic selling and forced exits. The second test matters more because it shows if sellers are still in control or if buyers are quietly stepping in. If the price doesn’t break lower and starts to steady, the risk shifts from more downside to possible upside. This idea is often taught in professional forex courses, like BabyPips’ explanation of double top and double bottom patterns.
What Does a Double Bottom Mean in Trading?
At its core, a double bottom shows a change in how the market is behaving, but it doesn’t guarantee a reversal:
- Selling pressure is being absorbed rather than expanded
- Large participants begin accumulating positions
- Downside risk weakens as upside potential improves
What matters most isn’t just the low, but how the price reacts after hitting those lows.
Why the Double Bottom Pattern Signals Real Strength, Not Wishful Thinking
A real double bottom is more than just a pattern you see on a chart. It shows what’s really happening in the market. The price action tells you that buyers are taking back control after selling pressure fades, not just making a neat shape.
Key indicators of genuine strength in a double bottom include:
- Stronger momentum on the second bounce
- Reduced selling volume, showing absorption of prior supply
- Reclaim of critical structure levels, confirming demand presence
This kind of strength comes from real market behavior, not just hoping for a perfect-looking pattern. Traders who pay attention to how the market reacts and the bigger context, instead of just the shape, are more likely to find good setups.
Double Top vs Double Bottom: Critical Differences Smart Traders Never Ignore
At first, double tops and double bottoms might look similar. But in real trading, they often act very differently. Knowing this difference is what sets professional traders apart from emotional retail traders.
From a classical charting perspective, both are among the most studied reversal formations in technical analysis literature. But professionals look beyond the shape and focus on market behavior:
- Speed of rejection vs speed of recovery – How quickly price reacts after the second test
- Volume expansion or contraction – Evidence of absorption or distribution
- Reaction at prior structure zones – How price respects or violates support/resistance
- Market sentiment during formation – Are buyers or sellers in control?
Spotting these small but important differences helps traders avoid emotional choices and lowers the risk of false breakouts or getting in too early.
Why Context Matters More Than Pattern Shape: What Most Traders Miss
One of the biggest mistakes retail traders make is judging double tops and double bottoms only by their shape and ignoring the market context. A pattern without context is just a drawing; it doesn’t tell you anything about what’s really happening in the market.
Professional traders evaluate patterns within the bigger picture, considering factors such as:
- Higher-timeframe trend – Is the overall market bullish, bearish, or neutral?
- Market phase – Are we in accumulation, expansion, or distribution?
- Liquidity conditions – Where is the supply and demand actually concentrated?
- Trading session timing – Which market participants are active and how does that affect movement?
If you don’t use these context checks, even a textbook double top or double bottom can lead you astray, causing bad entries or extra risk. Context is what turns patterns from simple drawings into useful trading tools.
How Professionals Confirm Double Top and Double Bottom Setups Before Committing Capital
Professional traders never trust pattern shape alone. Even a perfect double top or double bottom can fail if you ignore confirmation signals. Instead, they look for several pieces of evidence before making a trade.
Common confirmation techniques include:
- Break and retest of key levels – Ensures the market truly respects support or resistance
- Momentum divergence – Shows whether trend strength is weakening or reversing
- Volume expansion on confirmation – Indicates genuine participation by larger players
- Multi-timeframe alignment – Confirms the pattern is meaningful across higher and lower timeframes
Many traders use platforms like MetaTrader 4 to check these confirmations quickly. This helps them find setups that meet professional standards and avoid emotional mistakes.
Common Mistakes Retail Traders Keep Repeating (And How to Avoid Them)
Most trading losses aren’t caused by bad patterns, but by mistakes in execution and emotional choices. Retail traders often make the same errors over and over:
- Entering before confirmation – Jumping in too early without evidence of control shift
- Ignoring invalidation levels – Failing to respect points where the trade idea is no longer valid
- Trading against strong trends – Fighting the market instead of working with it
- Risking too much on a single setup – Ignoring proper position sizing and risk management
Keep in mind: patterns show probabilities, not certainties. Professional traders use setups as tools to guide them, not as promises.
Real Market Behavior: Why Perfection Rarely Exists
In real markets, double tops and double bottoms are almost never perfect. Wicks, false breakouts, and messy price moves are normal. Traders who expect perfect patterns often get surprised.
What really matters is how the market behaves, not how perfect the pattern looks:
- Reaction after the second test – Does price confirm a shift in control?
- Acceptance or rejection of key levels – Are prior support/resistance zones respected?
- Commitment from buyers or sellers – Is the move backed by real participation or just noise?
Professional traders pay attention to behavior, reactions, and confirmation—not to finding perfect patterns.
Final Verdict: When Double Top and Double Bottom Truly Deserve Your Attention
Double top and double bottom patterns can be powerful tools if you read them in the right context and confirm them with market behavior. They work best when:
- Aligned with higher-timeframe structure – confirming the broader trend supports the setup
- Confirmation is present – including break/retest, volume support, or momentum divergence
- Risk is clearly defined – proper stop-loss, position sizing, and invalidation points are set
However, these patterns should be avoided or treated with caution during:
- Directionless ranges, where structure is unclear
- Thin liquidity conditions, which amplify false moves
- High-impact news volatility, which can override technical setups
Choosing strong currency pairs or assets with clear price structure also makes these setups more reliable. The quality of the pattern matters more than how often it appears.
Author Note: From Practical Market Observation
This analysis comes from years of watching price behavior in forex, indices, and crypto markets through many market cycles. The ideas here are based on price action, liquidity, and careful risk management—not on looking back or aiming for perfect theory.
Markets reward patience, discipline, and understanding behavior—not just making predictions.
Disclaimer:
This article is for educational purposes only and does not constitute financial or trading advice. Double top and double bottom patterns indicate probability, not certainty. Always confirm setups, manage risk properly, and consult a qualified professional before trading.
FAQs: Double Top & Double Bottom Patterns
Is a double top always bearish?
No, A double top only signals potential weakness. Its true meaning depends on trend context, volume behavior, and confirmation from price action.
Can a double bottom fail in a strong downtrend?
Yes, Even multiple attempts at a double bottom can fail if the overall trend remains strong. Confirmation and higher-timeframe alignment are crucial.
Which timeframe is best for trading double tops and double bottoms?
Higher timeframes, such as 4-hour, daily, or weekly charts, provide more reliable signals by reducing market noise.
What is the key to trading double tops and double bottoms successfully?
Professionals focus on context, confirmation, and behavior — not just pattern shape. Waiting for break/retest, volume support, and trend alignment improves probability.
How do traders confirm double top or double bottom setups?
Common confirmation methods include break and retest of key levels, momentum divergence, volume expansion, and multi-timeframe alignment. Platforms like MetaTrader 4 help analyze these effectively.


2 thoughts on “Double Top and Double Bottom The Silent Signals That Smart Traders Trust”
Pingback: The Secret Behind Price Action Moves Sideways That Most Traders Overlook
Pingback: How Many Trading Days Are in a Year? The Number Most Traders Misuse