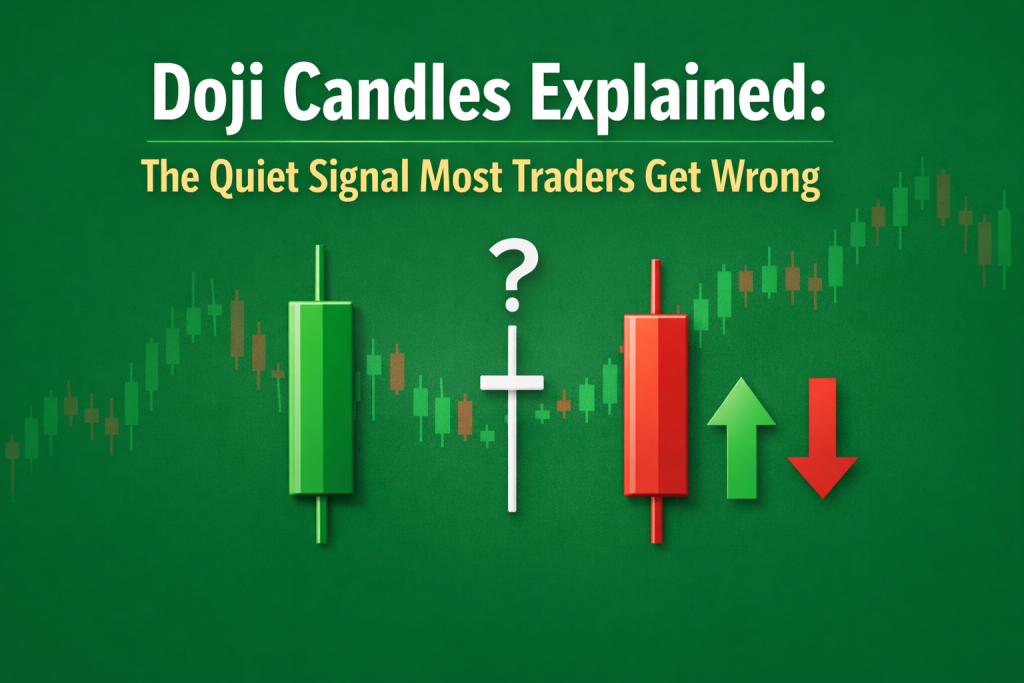
Doji Candles Explained: Why Smart Traders Don’t Trade Them Instantly
Most traders look for strong candles. Big bodies. Clear direction. Fast moves.
But after five years of intraday forex trading, one thing becomes clear very quickly:
The market often gives its most important information when it goes quiet.
That quiet moment is often shown by a doji candlestick.
Many traders spot a doji and enter immediately.
Others ignore it completely. Both usually lose.
In this guide, I’ll explain how experienced price-action traders actually read doji candles, why they form, and how to use them without guessing.
This article is based on real intraday forex experience, market psychology, and confirmation — not textbook candle definitions.
What a Doji Candle Really Shows on a Price Chart
A doji candle forms when price opens and closes at almost the same level.
But the real story is not the open and close — it is the struggle in between.
During that session:
- Buyers try to push price up
- Sellers try to push price down
- In the end, neither side takes control
This creates a moment of balance.
In simple words:
The market pauses and waits before making its next move.
From real intraday trading experience, this pause usually appears:
- After a strong move, when momentum starts to slow
- Near important support or resistance levels
- Before volatility increases during active trading sessions
This is why a doji candle should not be traded on its own.
A doji does not give a clear signal.
It asks a question — and the next candles give the answer.
Doji Candle Meaning in Real Trading Psychology
Most websites say a doji means “indecision.”
That’s incomplete.
In real markets, a doji represents conflict.
What it usually reflects:
- Smart money reducing or adjusting positions
- Late traders entering emotionally
- Liquidity being absorbed quietly
Professional traders don’t trade the doji itself. They observe what price does after it.
That reaction is where the real information lies.
What Does a Doji Candle Mean After a Strong Trend
Context changes everything.
After a strong uptrend, a doji may indicate:
- Buyer exhaustion
- Profit-taking
- Transition from momentum to range
After a strong downtrend, it may hint at:
- Selling pressure slowing
- Early accumulation
- Short covering
In sideways markets, a doji usually means nothing.
Location matters more than candle shape.
Doji Candle Pattern That Signals Market Uncertainty
Structurally, a doji has:
- A very small body
- Wicks on one or both sides
But what truly matters is where it appears:
- At highs
- At lows
- At major support or resistance
- After impulsive moves
From years of intraday trading, most losing trades happen when traders:
- Ignore structure
- Trade patterns in isolation
- Enter without confirmation
Types of Doji Candles Every Trader Should Know
Different doji shapes reflect different emotions.
Some show rejection.
Some show absorption.
Some show exhaustion.
Understanding these differences helps you avoid false reversals and late entries.
Dragonfly Doji Candle and Hidden Buying Pressure
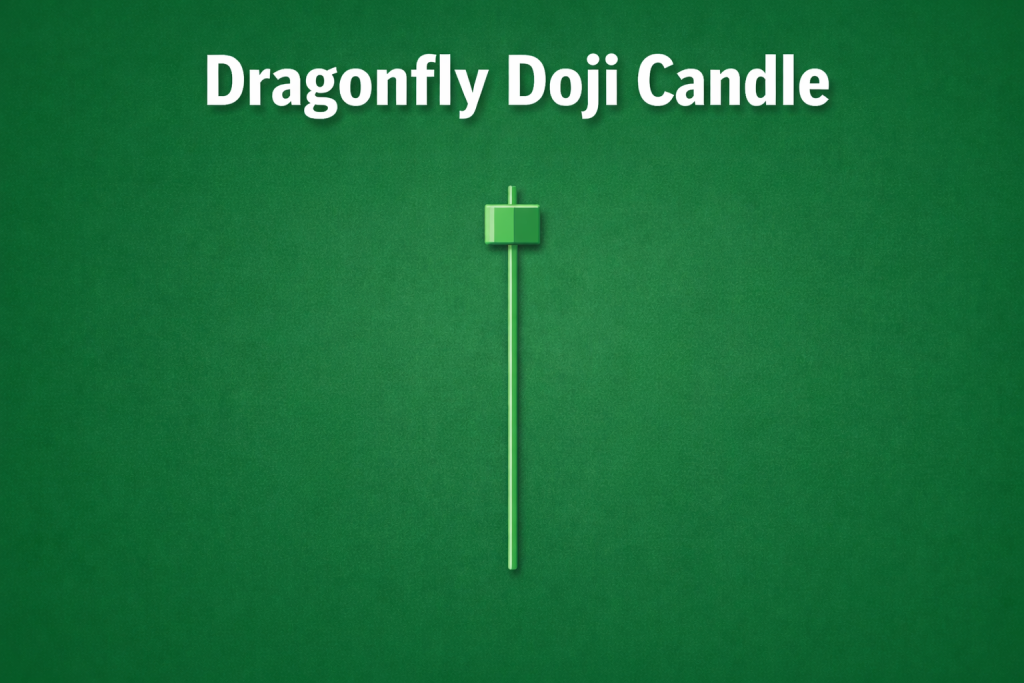
A dragonfly doji has:
- A long lower wick
- Almost no upper wick
It shows sellers pushed price down aggressively, but buyers absorbed everything and pushed price back up.
It often appears near:
- Demand zones
- Trend support
- Range lows
This does not mean “buy instantly.”
It means sellers are losing control.
Gravestone Doji Candle and Exhausted Buyers
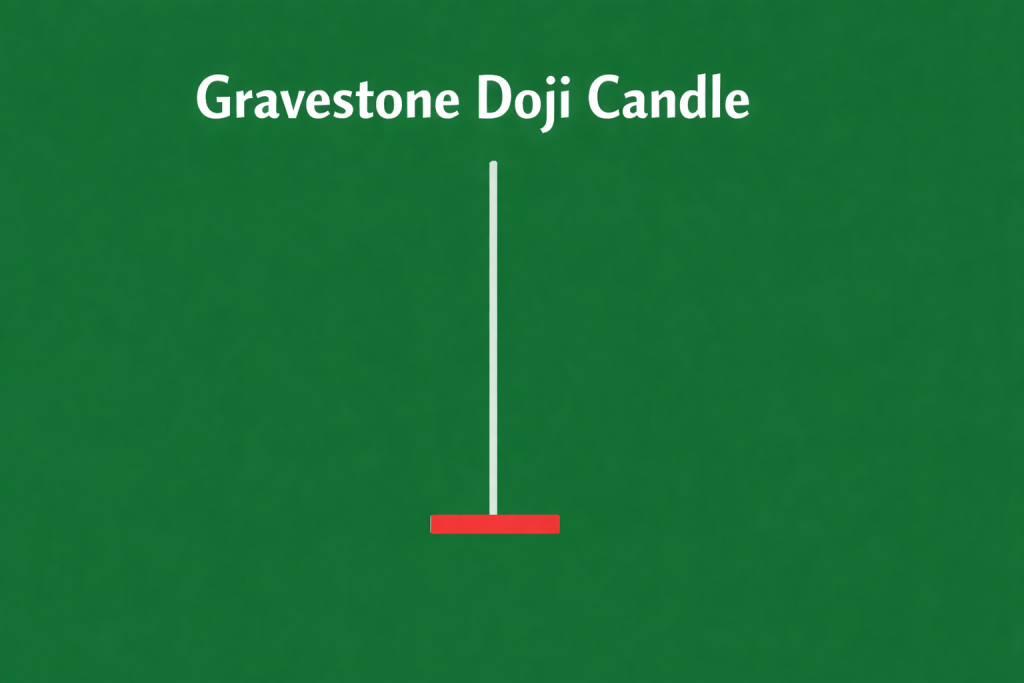
A gravestone doji has:
- A long upper wick
- Almost no lower wick
Buyers push price higher, but sellers reject those prices strongly.
It commonly forms:
- Near resistance
- After parabolic moves
- Around emotional breakouts
This shows buyer weakness, not guaranteed reversal.
Bullish Doji Candle That Warns Sellers Too Early
This doji appears during selling pressure and often tricks sellers into entering early.
Experienced traders wait for:
- A strong bullish close after the doji
- Clear structure support
- Volume or session confirmation
Without confirmation, it’s just noise.
Bearish Doji Candle That Smart Traders Wait On
This doji forms during buying pressure but fails to continue higher.
Professionals look for:
- Weak follow-through
- Lower highs
- Breakdown of structure
They don’t short just because it appears.
Green Doji Candle vs Red Doji Candle Explained
Many traders focus on candle color.
They shouldn’t.
Color only shows which side closed slightly stronger.
The real story is in:
- Wick rejection
- Location
- Trend strength
A green doji can still be bearish.
A red doji can still be bullish.
Doji Hammer Candle and Reversal Confusion
This candle often confuses traders because it looks like a hammer.
The key difference is simple:
- A hammer has a clear body
- A doji shows balance
Because of this, it should be treated as a warning sign, not a reversal trigger on its own.
To understand how hammer and inverted hammer candlestick structures actually work within real market context, it’s important to study their role in trend continuation and rejection rather than relying on shape alone.
Reversal Doji Candle That Signals a True Trend Shift
A doji becomes powerful only when:
- It appears at a key level
- It follows an extended move
- The next candle confirms direction
Without confirmation, reversals fail.
This is why experienced traders wait one candle longer than beginners.
Reverse Doji Candle Myth Most Traders Believe
Many online sources label almost every doji as a reversal.
This is dangerous.
Markets don’t reverse because of candles.
They reverse because order flow changes.
Candles only reflect that change — they don’t cause it.
Doji Candles in Live Trading, Not Textbook Charts
Real charts are messy:
- Bodies are not perfect
- Wicks vary by broker
- News distorts structure
Rigid rules fail in live markets.
Doji candles work best when combined with:
- Trend direction
- Key levels
- Market structure
For early reversal warnings that naturally complement doji behavior, experienced traders often study shooting star candlestick formations, which highlight buyer exhaustion and rejection at key levels.
How Doji Candles Work With Other Price Action Signals
Doji candles become more reliable when paired with:
- Engulfing failures
- Rejected breakouts
- Liquidity sweeps
For example, when a doji forms near a failed engulfing structure, the probability of a meaningful move often increases.
The same concept applies to harami-based indecision patterns, where price hesitation appears inside a broader market structure and signals a potential shift in order flow.
A Professional View on Doji Candles
Institutions don’t trade candle names.
They trade:
- Liquidity
- Risk
- Time
Doji candles help professionals identify moments when retail traders are confused.
That confusion becomes opportunity — but only with confirmation.
Final Thoughts From a Price Action Perspective
Doji candles are not magic.
They don’t predict the future.
They reveal:
- Pressure
- Hesitation
- Transition
If you:
- Trade them alone → you will lose
- Ignore them completely → you will be late
- Read them with structure → you gain an edge
The market speaks softly before it moves fast.
Doji candles are that whisper.
Risk Disclaimer
This content is for educational purposes only and does not constitute financial advice.
Forex trading involves risk, and past performance does not guarantee future results.
Always manage risk properly and confirm setups before entering any trade.
Frequently Asked Questions About Doji Candles
What is a doji candle in simple words?
A doji candle is a candlestick where the opening and closing price are almost the same. It shows that buyers and sellers are equally strong, which means the market is unsure about the next move.
Are doji candles bullish or bearish?
Doji candles are neither bullish nor bearish by themselves. Their meaning depends on where they appear on the chart and what price does after them.
Can a doji candle signal a reversal?
Yes, a doji can signal a possible reversal, but only when it forms after a strong trend and gets confirmation from the next candle.
Is it safe to trade only using doji candles?
No, Trading only on doji candles is risky. They should always be used with trend direction, support and resistance, and confirmation candles.
What timeframe works best for doji candles?
Doji candles work better on higher timeframes like H1, H4, and Daily charts because lower timeframes often create false signals.
Why do doji candles fail sometimes?
They fail when traders ignore market context. A doji in the middle of a range or low-volume market usually has no meaning.
Do professional traders use doji candles?
Yes, but not as entry signals. Professionals use them to understand market hesitation, manage risk, and prepare trade scenarios.
Can doji candles appear during news events?
Yes, but during high-impact news they are often unreliable because volatility distorts normal price behavior.
Are doji candles useful in forex trading?
Yes, they are widely used in forex trading to identify market pauses, possible reversals, and trend weakness.