
Bullish Harami & Bearish Harami: The Hidden Reversal Patterns Most Traders Miss
Many traders jump from one indicator to another. They chase breakouts and react to every price move. Still, they often miss the key moment when the market is about to reverse.
Real reversals are rarely obvious.
Two of the most underrated but powerful candlestick signals, the Bullish Harami and Bearish Harami, often show up before a big move, not after. They don’t grab attention or trigger alerts. Instead, they quietly reveal a shift in market control that most traders miss.
Traders who learn to read these patterns gain a hidden advantage: earlier entries, tighter risk, and calmer decision-making, while others react late.
In this guide, you’ll discover:
- What the Harami candlestick pattern is really telling you
- How to correctly spot Bullish Harami and Bearish Harami before the crowd
- The market psychology behind each setup
- When these patterns work—and when they completely fail
- Practical trading strategies used by disciplined traders
What Is the Harami Candlestick Pattern—and Why Does It Appear Before Reversals?
The word “Harami” comes from a Japanese term meaning pregnant, and in candlestick trading, that meaning is surprisingly accurate.
A Harami candlestick pattern forms when a small candle is completely contained within the body of the previous large candle. At first glance, it may look insignificant, but this structure reveals something important: momentum is stalling, and control is quietly shifting.
Instead of showing aggressive buying or selling, the Harami pattern reflects indecision. Buyers and sellers are no longer pushing price with the same confidence, creating a pause that often appears just before a meaningful market move.
Unlike strong reversal patterns that demand immediate attention, the Harami pattern is subtle. It doesn’t promise an instant trend change, but it acts as an early warning signal that the current trend may be losing strength.
There are two main types of Harami patterns, each appearing in a different market context:
- Bullish Harami – forms after a downtrend and hints at weakening selling pressure
- Bearish Harami – forms after an uptrend and signals fading buyer momentum
Understanding the difference between these two is critical. A Harami candle on its own means very little—but when you read it in the right context, it can reveal what the market is preparing to do next.
Bullish Harami – The Early Warning That a Downtrend Is Losing Strength
A Bullish Harami doesn’t appear when the market is already bullish. It forms when fear is still visible on the chart, but the selling pressure quietly begins to fade.
At this stage, price may still look weak, but underneath, momentum is changing. This is often the first hint that sellers are losing control.
What Is a Bullish Harami?
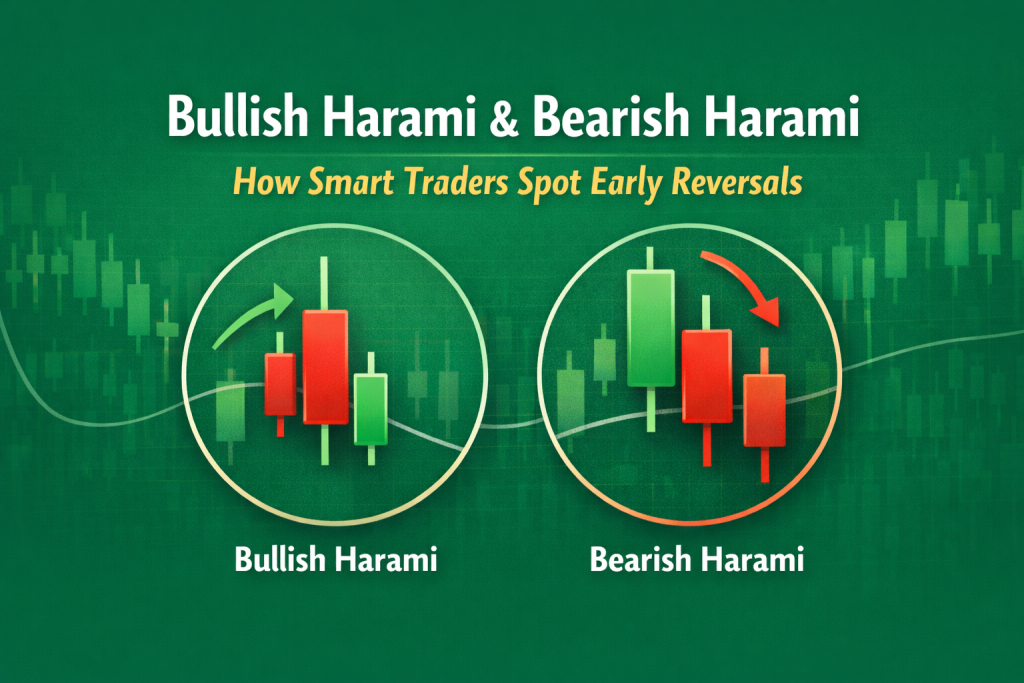
A Bullish Harami is a two-candle formation that develops after a downtrend and includes:
- A large bearish candle (red or black) that reflects strong selling pressure
- Followed by a small bullish candle that forms completely inside the body of the previous candle
This structure shows that sellers failed to continue pushing price lower, while buyers cautiously start stepping in.
Many traders mistake this setup for a normal pause in price action. But when it appears at the right market location, it often marks the early phase of a bullish reversal.
Bullish Harami Candle Structure Explained
The bullish harami candle setup tells a quiet but important story:
- The first candle shows dominant sellers in full control
- The second candle reflects hesitation, balance, and reduced selling pressure
The bullish candle doesn’t need to be large or aggressive. Its real significance is where it forms and what it represents: a clear loss of bearish momentum.
This subtle shift is often missed by impatient traders but recognized early by experienced ones.
Bullish Harami Candlestick Pattern Psychology
The psychology behind the bullish harami candlestick pattern is simple, yet extremely powerful.
After a sustained downtrend:
- Sellers begin locking in profits
- New sellers hesitate to enter at lower prices
- Buyers start testing the market, sensing value
The small bullish candle reveals that bearish momentum is no longer aggressive. Fear begins to fade, and balance slowly returns.
If buyers get confirmation in the next candles, this change in psychology often leads to a real trend reversal instead of a short-lived bounce. Other candlestick patterns, like the Shooting Star Candlestick, also help traders spot reversals from the opposite direction.
When Is the Bullish Harami Pattern Most Reliable?
Not every Bullish Harami leads to a profitable trade. The pattern becomes far more effective when multiple factors align, such as:
- It appears after a clear and extended downtrend
- Price is reacting near a strong support level
- Volume contracts on the first candle and stabilizes on the second
- Momentum indicators (like RSI) show oversold conditions. Momentum indicators (like RSI) show oversold conditions, and traders often combine them with RSI signals that reveal trend reversals to confirm momentum shifts before entering.
Without context, a bullish harami pattern is just another candle on the chart.
With the right context and confirmation, it becomes a high-probability reversal signal.
Bearish Harami – The Silent Warning Before an Uptrend Breaks
A Bearish Harami appears when confidence is high, charts look bullish, and most traders think the trend will continue. That’s what makes this pattern so dangerous and so powerful.
It doesn’t shout that the market is about to fall. Instead, it quietly signals that buying strength is fading, often just before the trend starts to turn.
What Is a Bearish Harami?
A Bearish Harami is a two-candle formation that develops after an uptrend and consists of:
- A large bullish candle showing strong buying pressure
- Followed by a small bearish candle that forms completely inside the body of the first candle
This structure suggests that buyers failed to push prices higher, while sellers are slowly beginning to regain control.
To inexperienced traders, this may look like a normal pause. To skilled traders, it’s often an early warning that the uptrend is losing momentum.
Bearish Harami Candlestick Structure Explained
The bearish harami candlestick tells a clear story when read correctly:
- Buyers push price upward with strength
- Suddenly, price struggles to continue higher
- A small bearish candle forms, signaling hesitation and balance
This hesitation rarely appears randomly. It often shows up near the end of an uptrend, just before a pullback or sometimes a full trend reversal.
Bearish Harami Candlestick Pattern Psychology
The bearish harami candlestick pattern reflects a shift in trader behavior:
- Buyer exhaustion after a prolonged rally
- Profit-taking by smart money at higher prices
- Early seller interest entering quietly
While retail traders often chase the uptrend and enter late, experienced traders notice the loss of momentum and get ready for a possible move in the opposite direction.
When Does the Bearish Harami Pattern Work Best?
Not every Bearish Harami leads to a reversal. The pattern becomes far more reliable when it appears under the right conditions:
- After a strong and extended uptrend
- Near a key resistance or supply zone
- When momentum indicators show overbought conditions
- When volume declines on the second candle, signaling weakening demand
On its own, a bearish harami pattern is simply a warning.
With confirmation from price action and context, it becomes a high-probability reversal signal.
Bullish Harami vs Bearish Harami – The Difference Most Traders Get Wrong
At first glance, Bullish Harami and Bearish Harami look almost identical. Both involve a small candle forming inside a larger one, and both signal hesitation in the market.
But confusing the two can be costly.
The real difference isn’t just in candle color; it’s in market context and directional bias. Understanding this helps traders avoid false signals and trade with clarity instead of guesswork.
Key Differences Between Bullish Harami and Bearish Harami
| Feature | Bullish Harami | Bearish Harami |
| Market Context | Forms after a downtrend | Forms after an uptrend |
| First Candle | Strong bearish candle | Strong bullish candle |
| Second Candle | Small bullish candle | Small bearish candle |
| Signal Type | Potential bullish reversal | Potential bearish reversal |
| Trader Bias | Buyers slowly stepping in | Sellers quietly preparing to enter |
Both patterns represent indecision, but they appear at opposite ends of the trend.
A Bullish Harami hints that selling pressure is fading after a decline, while a Bearish Harami warns that buying strength may be running out after a rally. Recognizing this difference allows traders to align their bias with the market instead of fighting it.
How to Trade the Bullish Harami and Bearish Harami Like a Pro
Candlestick patterns can offer powerful insights, but trading them without a plan often leads to losses. Experienced traders always combine Harami patterns with confirmation, proper risk management, and a clear plan.
Here’s a step-by-step approach to trading Bullish and Bearish Harami patterns safely.
Entry Strategy
Bullish Harami:
Enter a trade only after a bullish confirmation candle closes above the Harami’s range. This helps make sure the buying momentum is real and not just a temporary pause.
Bearish Harami:
Enter a trade only after a bearish confirmation candle closes below the Harami’s range. This helps avoid false signals and confirms that sellers are taking control.
Confirmation is the key to separating high-probability setups from misleading patterns.
Stop-Loss Placement
Proper stop-loss placement keeps your risk under control:
- Bullish Harami: Place your stop-loss just below the low of the Harami pattern
- Bearish Harami: Place your stop-loss just above the high of the Harami pattern
This helps limit losses if the market moves against you, while still giving the trade enough room to develop.
Take-Profit Strategy
Target setting is just as important as entry:
- Bullish Harami: Aim for the nearest resistance level
- Bearish Harami: Target the nearest support level
- Always keep at least a 1:2 risk-reward ratio to stay consistent over time. To calculate the right position sizes and manage risk, tools like our Lot Size Calculator are very helpful.
By combining confirmation, precise stop-loss placement, and a disciplined take-profit strategy, traders can use Harami patterns to capture meaningful market moves while controlling risk.
Common Mistakes Traders Make with Harami Patterns
Even the best candlestick patterns can fail if traders misread them. Many beginners lose confidence not because the pattern is weak, but because they use it incorrectly.
Here are the most common mistakes traders make with Harami patterns:
- Trading without trend context: A Harami alone doesn’t indicate direction; ignoring the bigger trend often leads to losses.
- Entering without confirmation: Jumping in before a confirming candle forms increases the risk of false signals.
- Ignoring support and resistance: Key levels give context to the pattern; ignoring them reduces accuracy.
- Expecting immediate reversals: Harami patterns signal potential change, not instant flips.
- Using Harami patterns in isolation: Without other confluences like volume or indicators, the signal is weak.
Avoiding these mistakes can greatly improve your trading accuracy and help you trust patterns when it matters most.
Is the Harami Candlestick Pattern Reliable?
The Harami candlestick pattern is not a magic formula. Its strength comes from context, confirmation, and proper interpretation.
When it works best:
- Combined with trend analysis
- Forming near key support or resistance levels can boost reliability, especially when you understand how these basics influence reversals on price charts.
- Confirmed by subsequent price action
When it can fail:
- In a strong, trending market where momentum overwhelms hesitation
- During high volatility or news events
- When traders expect guaranteed reversals without waiting for confirmation
Professional traders see Harami patterns as a warning signal, not a command. They respect the subtle shift in market psychology and wait for evidence before making a move.
When used wisely, Harami patterns can give you a critical edge by highlighting moments when trends are slowing down and reversals may be near.
Pro Tips to Trade Harami Patterns Like Smart Money
Harami patterns may look simple, but trading them well takes strategy and patience. To improve your accuracy, consider these professional tips:
- Use higher timeframes for stronger signals: Patterns on higher charts (like 4H or daily) are more reliable than intraday candles.
- Combine Harami patterns with volume analysis: A shift in volume confirms whether buyers or sellers are gaining control.
- Look for confluence with moving averages: Support, resistance, and moving averages increase the probability of a successful trade.
- Avoid trading against strong momentum: Harami patterns work best at trend exhaustion, not against ongoing power moves.
- Wait patiently: The market rewards disciplined traders. Don’t rush entries; let confirmation candles guide you.
These small adjustments set smart traders apart from amateurs, turning a simple pattern into a high-probability trading signal.
Conclusion
The Bullish Harami and Bearish Harami may not be flashy or exciting, but they are reliable, powerful signals that reveal real market psychology.
They don’t predict the future; they reflect changing behavior in buyers and sellers. When combined with:
- Proper trend analysis
- Confirmation candles
- Smart risk management
…these patterns help traders enter earlier, exit smarter, and avoid emotional decisions.
Mastering the Bullish Harami and Bearish Harami candlestick patterns won’t make you rich overnight, but it will make you more consistent—and in trading, consistency is everything.
Disclaimer:
Trading involves risk. This article is for educational purposes only and is not financial advice. Always use proper risk management and consult a licensed professional before making trading decisions.


1 thought on “Bullish Harami & Bearish Harami How Smart Traders Spot Early Reversals”
Pingback: Inverse Head and Shoulders Pattern Why This Quiet Setup Starts Strong Trends | GuriFx