
Bullish Divergence and Bearish Divergence: What Most Traders Ignore But Professionals Watch
Most traders believe indicators tell the full story of the market. They wait for RSI to hit overbought, MACD to cross, or price to break a level. But professionals know one thing: price usually gives warning signs before the move actually happens.
That early warning is called bullish divergence and bearish divergence.
This article explains divergence from a real market behavior perspective, not textbook theory. You will understand how divergence forms, why it works, and how smart traders use it without overcomplicating charts.
Why Divergence Works Even When Indicators Fail
Markets move because of orders, not indicators. Indicators only react to price. Divergence works because it highlights weakness or strength hidden behind price movement.
When price makes a new high or low but momentum does not confirm it, something is wrong. Big players often reduce positions quietly while retail traders chase moves emotionally.
If you want to understand this behavior deeply, price structure matters. That is why sideways markets often come before strong moves. You can explore this idea further in The Secret Behind Price Action Moves Sideways That Most Traders Overlook.
Divergence often forms during such phases.
What Is Bearish Divergence And Why Price Looks Strong Before Falling
So, what is bearish divergence really telling you?
It appears when price keeps moving higher, but momentum fails to confirm that strength. On the surface, the market looks bullish. Underneath, buying pressure is quietly fading.
This is exactly where many retail traders feel confident — and get trapped — because they only see price, not what is happening behind it.
Bearish Divergence Meaning In Simple Trading Language
The bearish divergence meaning is very simple:
Buyers are still pushing price up, but they are doing it with less power than before.
This does not mean the market must reverse immediately. It means risk is increasing, and upside strength is no longer healthy.
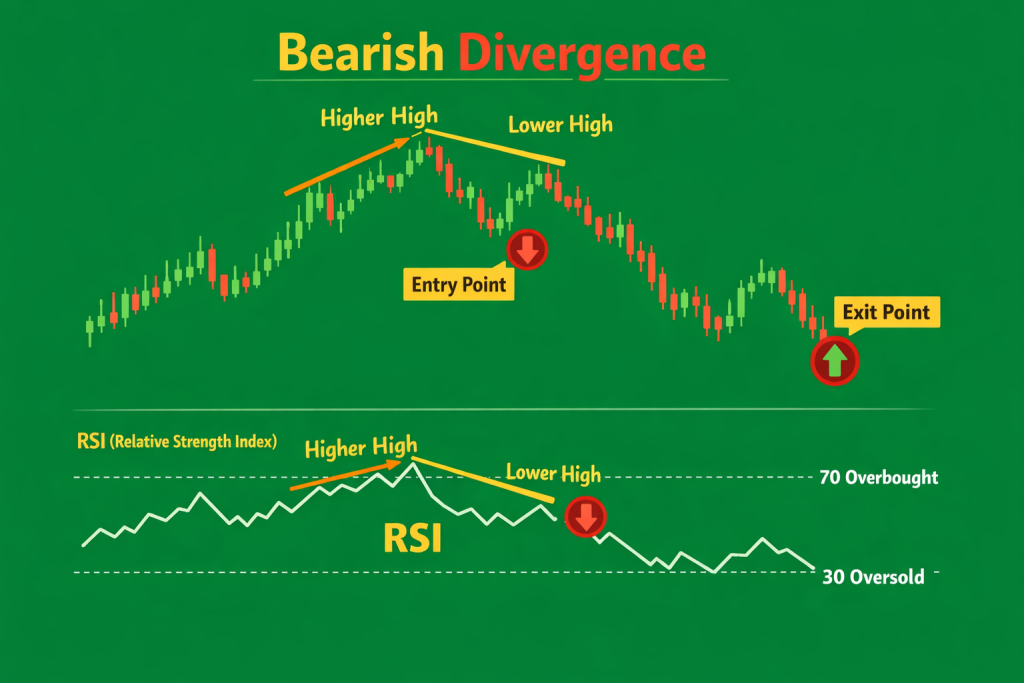
Bearish Divergence RSI Explained With Clear Logic
Bearish divergence RSI forms when price makes a higher high, but RSI makes a lower high.
RSI measures momentum, not direction. When momentum weakens while price rises, it shows that buyers are getting tired.
This often happens near the end of strong uptrends.
RSI Bearish Divergence And Momentum Weakness
RSI bearish divergence is most reliable near resistance zones or after long bullish runs.
In the middle of a strong trend, divergence alone is not enough. Context always matters.
Experienced traders wait for price behavior to confirm what RSI is hinting at.
Bearish RSI Divergence Meaning Traders Ignore Too Often
The bearish rsi divergence meaning is commonly misunderstood.
It is not a sell signal by itself. It is a warning.
Confirmation from price action improves reliability. Rejection candles, failed breakouts, or upper-wick patterns often validate divergence. One strong example is explained here: https://guriforex.com/hanging-man-pattern-the-silent-signal-smart-traders-never-ignore/
Bearish Divergence MACD Vs RSI Which Is More Reliable
Bearish divergence macd focuses more on trend momentum than speed.
MACD reacts slower than RSI, which makes it more stable on higher timeframes, but less effective for early entries.
Many professionals use RSI for early warning and MACD for confirmation.
Bearish SMT Divergence And Smart Money Traps
Bearish smt divergence appears when two correlated markets fail to confirm each other.
If one market makes a higher high while the other does not, it may signal institutional distribution rather than real strength.
This is often seen before sharp reversals or deep pullbacks.
Hidden Bearish Divergence Why Trends Break Quietly
Hidden bearish divergence usually forms during pullbacks inside a downtrend.
Instead of signaling reversal, it confirms trend continuation.
Many traders confuse it with regular divergence and enter against the trend — a mistake professionals avoid.
What Is Bullish Divergence And How It Signals Silent Buying
So, what is bullish divergence in real market terms?
It forms when price creates a lower low, but momentum fails to follow. Price keeps falling, yet selling pressure is clearly weakening.
This is often the phase where emotional sellers exit — and smart money quietly starts buying.
Bullish Divergence Meaning Without Indicator Confusion
The bullish divergence meaning is very clear:
Sellers are losing control, even though price has not reacted yet.
It does not guarantee an instant reversal. It simply warns that downside strength is fading.
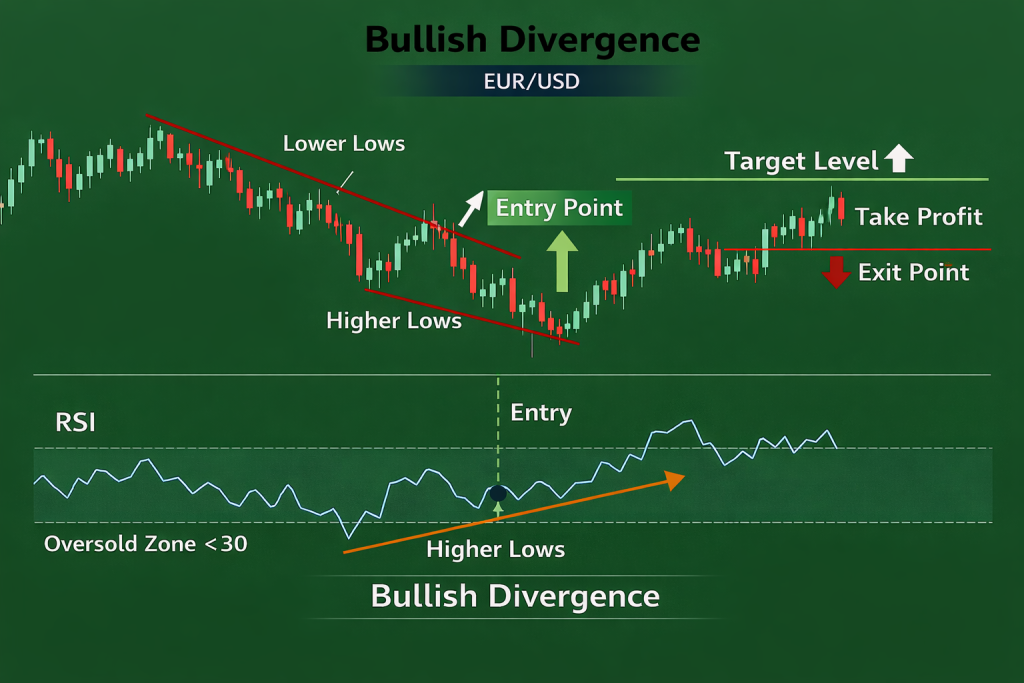
Bullish Divergence RSI And Seller Exhaustion
Bullish divergence rsi appears when price makes lower lows while RSI prints higher lows.
This usually develops near strong support zones or after aggressive selloffs, where sellers are running out of momentum.
RSI Bullish Divergence In Real Market Conditions
RSI bullish divergence works best when combined with price action confirmation.
On its own, it is just information. With structure, rejection, or volume clues, it becomes actionable.
For understanding reversal candles that often confirm divergence, this guide is helpful for you.
Bullish RSI Divergence And Trend Continuation
Bullish rsi divergence is not limited to reversals.
It can also appear during pullbacks inside strong uptrends, offering high-probability continuation entries instead of chasing breakouts.
Bullish Divergence MACD And Early Reversal Signs
Bullish divergence macd focuses on slowing bearish momentum rather than price speed.
It often forms before larger reversals but requires patience and higher timeframe confirmation.
MACD Bullish Divergence When Momentum Shifts First
Macd bullish divergence is more reliable on higher timeframes, where noise is reduced.
Professional traders often use it to confirm RSI signals rather than replace them.
Hidden Bullish Divergence Used By Trend Traders
Hidden bullish divergence signals that the trend remains strong.
Instead of warning about reversal, it shows that pullbacks are likely to hold and continuation is probable.
Bullish Hidden Divergence During Pullbacks
Bullish hidden divergence helps traders enter trending markets at better prices, avoiding emotional breakout entries.
SMT Divergence In Bullish Market What Smart Money Watches
SMT divergence in bullish market appears when correlated markets fail to move in sync.
This often hints at short-term pullbacks while the broader bullish structure remains intact.
Bullish And Bearish Divergence Compared Side By Side
Bullish and bearish divergence both show disagreement between price and momentum. The key difference is market direction and location.
Hidden Bullish And Bearish Divergence Key Differences
Hidden bullish and bearish divergence support existing trends, while regular divergence often warns of reversals.
Bearish Bullish Divergence Common Trader Confusion
Many traders confuse bearish bullish divergence by ignoring higher timeframe structure, leading to early entries.
Bullish Divergence Pattern That Improves Entry Timing
A high-quality bullish divergence pattern does not appear randomly. It follows a clear market sequence that experienced traders learn to recognize over time.
It usually develops after a strong selloff, when fear is high but momentum begins to fade. As selling pressure weakens, market structure holds, showing that buyers are quietly absorbing orders. Finally, a clear confirmation candle appears, signaling that control is starting to shift.
Divergence does not improve certainty. It improves entry timing — helping traders avoid late entries and unnecessary risk.
Why Most Traders Mislabel Bearish Divergance
The term bearish divergance is widely misused because many traders search for signals instead of understanding market behavior. They draw divergence on every small move, without considering trend direction, liquidity zones, or overall structure.
This leads to early entries, false signals, and unnecessary losses. Experienced traders know that divergence only works when it appears in the right location and market condition.
Execution also plays a role. Using reliable tools across devices helps reduce mistakes and improve consistency. If you trade on multiple platforms, this guide can help: https://guriforex.com/metatrader-4-secrets-how-to-trade-smarter-on-any-device/
Final Thoughts How To Trade Divergence Like A Professional
Professional traders never treat divergence as a signal on its own. They always combine it with market structure, price action, and proper risk management.
- Bullish divergence works best near demand zones.
- Bearish divergence is strongest near resistance.
- Confirmation always matters, and risk management comes first.
Remember, divergence is a warning system, not a magic entry button. It signals potential shifts in momentum, giving you time to plan your trades rather than forcing an immediate decision.
Used correctly, divergence can improve market timing, reduce emotional mistakes, and help you trade more like a professional.
Disclaimer:
Trading involves risk. This article is for educational purposes only and is not financial advice. Always use proper risk management and consult a licensed advisor before trading.
Frequently Asked Questions
What is divergence in trading?
Divergence happens when price and momentum indicators move in different directions, signaling potential weakness or strength behind price.
Is bullish divergence a buy signal?
No, Bullish divergence is a warning of weakening selling pressure. Confirmation from price action is still required.
Does bearish divergence always mean price will fall?
No, Bearish divergence only shows weakening buying momentum. Price may consolidate before any move.
Which indicator is best for spotting divergence?
RSI is commonly used for early signals, while MACD works better for higher-timeframe confirmation.
Can divergence work in strong trends?
Yes, but it is more reliable near key support or resistance levels and during pullbacks.
What is the difference between regular and hidden divergence?
Regular divergence often signals reversals, while hidden divergence usually indicates trend continuation.
Should beginners trade using divergence alone?
No, Divergence should always be combined with structure, price action, and proper risk management.
1 thought on “Bullish Divergence and Bearish Divergence: The Silent Market Signals Most Traders Never Notice”
Pingback: ORB Trading Strategy: Why Smart Day Traders Trust the Opening Range