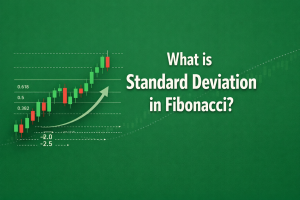

What is Standard Deviation in Fibonacci? A Trader’s Guide to Smarter Projections
Let’s be honest—if you’ve been trading for a while, you’ve probably experienced this.
You spot a strong bullish move on EUR/USD. Price is pushing up fast, everything looks clean, and then it starts to pull back. You quickly grab your Fibonacci tool, expecting price to respect those key levels and continue higher.
But instead… price keeps dropping.
It breaks past your levels, hits your stop loss, and what looked like a perfect setup turns into frustration.
Sound familiar?
The problem isn’t always your analysis—it’s that traditional Fibonacci levels don’t account for market volatility. Price doesn’t move in a fixed pattern. Sometimes it stretches further than expected, especially during strong trends or high-impact sessions.
This is where standard deviation in Fibonacci comes into play.
Widely used in ICT (Inner Circle Trader) concepts, this approach enhances the traditional Fibonacci tool by adding volatility-based projections. Instead of relying on static levels, you get a clearer idea of how far price can realistically expand, where it may reverse, and where smart money is likely to react.
In this guide, you’ll learn what standard deviation in Fibonacci really means, how ICT traders apply it in real market conditions, how to set it up step by step, and how to use it to avoid common trading mistakes.
By the end, you’ll move away from guessing targets—and start projecting them with more confidence and precision.
Fibonacci in Forex Trading: Basic Concepts Explained
Fibonacci tools stem from the famous sequence discovered by Leonardo Fibonacci: 0, 1, 1, 2, 3, 5, 8, 13, and so on, where each number is the sum of the two preceding ones. In trading, we use ratios derived from this sequence—like 0.382, 0.5, 0.618, 0.786—to map potential support and resistance during pullbacks.
Traders draw the Fibonacci retracement from a swing low to a swing high (in uptrends) or high to low (in downtrends). These levels often act as magnets because so many participants watch them, creating self-fulfilling behavior.
But here’s the limitation: Traditional Fib levels assume uniform price behavior. In reality, markets are volatile—some moves are explosive, others choppy. Standard deviation helps bridge that gap by measuring how much price typically deviates from its average path.
What is Standard Deviation in Technical Analysis?
Standard deviation is simply a way to measure how much price moves away from its average over a certain period. In other words, it shows how “spread out” the market is.
Think of it like this:
In a calm market, price stays close to its average—this means low standard deviation. But during news events or strong breakouts, price starts moving aggressively in both directions, which results in high standard deviation.
This is important for traders because it helps you understand two key things:
- How volatile the market is
- How far price can realistically move
One of the most common examples is Bollinger Bands, where standard deviation is used to create dynamic bands around a moving average. When price moves too far from the average, it often signals that the market is stretched and may slow down or reverse.
However, in ICT-style trading, standard deviation is used a bit differently.
Instead of calculating it in the traditional statistical way, traders apply the concept using customized Fibonacci levels. These levels act as “deviation zones,” helping to project how far price can expand based on the strength of an impulsive move.
Standard Deviation in Fibonacci (ICT Method Explained)
In ICT trading, standard deviation in Fibonacci means customizing the Fibonacci tool so its levels act like “deviation multiples” based on a price swing.
Instead of relying on default Fibonacci levels, traders manually adjust them to better reflect how far price can realistically expand after an impulsive move.
The key idea is simple:
Use the Fibonacci retracement or extension tool and set these custom levels:
- 1 (starting point or 100% of the move)
- 0 (the origin or equilibrium)
- -1
- -2
- -2.5
- -4
These negative levels project price beyond the swing, treating each level as a multiple of deviation from the original move.
But why use negative levels?
When you anchor the tool from high to low (or low to high), these negative extensions naturally project outward in the direction where price is likely to expand—whether it’s continuation or a final push before reversal.
How ICT Traders Interpret These Levels
Each level represents a different degree of price expansion:
- -1 SD → Minor extension or short-term target
- -2 SD → Strong reaction zone (very common take-profit level)
- -2.5 SD → High-probability expansion area in trending markets
- -4 SD → Extreme move (rare, often signals exhaustion)
In many cases, these levels line up with key ICT concepts like liquidity pools, fair value gaps (FVGs), or order blocks—adding extra confirmation to your trade idea.
Quick Reference Table
| Level | Deviation | Meaning |
| 1 | Starting / 100% | Beginning of the move |
| 0 | Mean / Equilibrium | Baseline reference |
| -1 | 1 SD | Minor target |
| -2 | 2 SD | Strong reaction zone |
| -2.5 | 2.5 SD | High-probability expansion |
| -4 | 4 SD | Extreme move / exhaustion |
At its core, this approach transforms a basic Fibonacci tool into a volatility-based projection system, helping you move from guessing targets to planning them with structure.
How to Use Standard Deviation Fibonacci in Trading (Step-by-Step Guide)
Step-by-Step Setup on TradingView or MetaTrader
Setting up this tool is simple, but small mistakes can ruin your analysis. Follow these steps carefully:
- Select the Fibonacci Retracement tool (or Extension tool depending on your platform).
- Right-click on the chart → go to Settings → Levels tab.
- Remove the default levels and add these custom values:
1, 0, -1, -2, -2.5, -4 - Adjust colors for better visibility (for example, use red for negative levels).
- Anchor the tool correctly:
- Bullish move → drag from swing low to swing high
- Bearish move → drag from swing high to swing low
- Focus only on the negative extension levels for projections.
Pro Tip: Most beginners fail because they anchor randomly. Always use a clear impulsive move.
Trading Strategies Using Standard Deviation Fibonacci
Strategy 1: Reversal Setup (Liquidity Grab + Rejection)
After a strong bullish move, price often retraces to grab liquidity before reversing.
Here’s how to trade it:
- Anchor the Fibonacci tool on the manipulation leg (fake move).
- Watch price near -2 or -2.5 levels
- Look for confirmation:
- Pin bar
- Engulfing candle
- FVG or order block
Entry: After confirmation
Stop Loss: Below recent low
Target: Previous structure or equilibrium
Real Example Insight:
In my observation, pairs like GBP/USD often react sharply at the -2.5 level, especially after aggressive moves. These zones frequently align with smart money reversals.
Strategy 2: Trend Continuation Targets
In strong trending markets, price doesn’t just stop at basic levels—it expands aggressively.
Here’s how to use it:
- Use -4 level as an extended take-profit zone
- Combine with:
- RSI divergence
- Momentum exhaustion
This helps you avoid exiting trades too early.
Combining with Other Trading Tools
For higher accuracy, never rely on Fibonacci alone.
Combine it with:
- Order blocks or breaker blocks
- Volume spikes (news-driven moves)
- Session timing:
- London session
- New York session
Important: Volatility changes with sessions—this directly affects deviation levels.
Advantages of Standard Deviation Fibonacci
Why This Method Improves Your Trading
- Removes emotional decision-making
- Provides structured profit targets
- Aligns with institutional trading behavior
Many traders notice better risk-to-reward ratios and fewer early exits.
Common Mistakes to Avoid
Avoid these critical errors:
- ❌ Incorrect anchoring (random swings)
- ❌ Ignoring market conditions (range vs trend)
- ❌ Using the tool without confluence
- ❌ Trading in low-liquidity sessions
🔍 Quick Self-Check
Have you ever closed a trade too early just because price looked “overextended”?
That’s exactly where this method helps—you stay in trades longer with confidence.
Elevate Your Trading with Standard Deviation in Fibonacci
Combining standard deviation in Fibonacci with traditional price analysis gives you a more structured and objective way to identify targets, reversals, and market expansions. This approach is especially powerful in volatile markets like forex pairs (EUR/USD, GBP/USD) and even stocks during earnings seasons.
From my experience, traders who rely only on basic Fibonacci levels often exit too early or set unrealistic targets. But when you apply deviation-based projections, you start seeing how price actually behaves in real market conditions.
If you’re new to this method, start simple:
Open your demo account, apply the custom Fibonacci settings, and backtest at least 10–15 trades. Pay close attention to how often price reacts around the -2 and -2.5 levels—you might be surprised by the consistency.
The goal is simple:
Stop guessing where price might go—and start projecting it with logic.
If you have a chart where this strategy worked (or failed), feel free to share it in the comments. Real examples help everyone learn faster.
Disclaimer:
Trading forex, stocks, or crypto involves significant risk of loss. This article is for educational purposes only and does not constitute financial advice. Always use proper risk management and trade at your own discretion.