
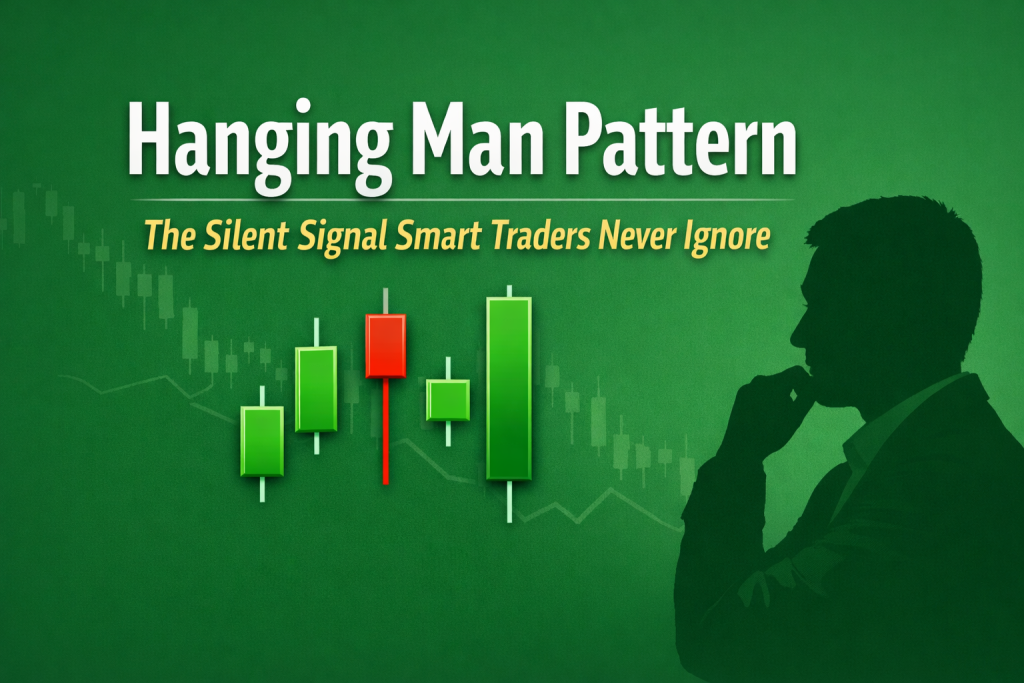
Hanging Man Pattern: Why Experienced Traders Pause Before Acting
Markets don’t usually reverse with drama.
Usually, markets give quiet signals before they change direction.
Price keeps rising. Buyers still look confident. Pullbacks are shallow and quickly bought. To most traders, everything appears normal.
Experienced traders notice when something is off. They spot a single candle that does not fit a healthy uptrend.
It doesn’t trigger panic selling.
It doesn’t break structure.
But it shows sellers were able to push the price down, even though the trend stayed strong.
This hidden weakness is what the hanging man pattern shows.
This pattern does not predict market tops. Instead, it helps traders avoid chasing a trend when momentum is slowing down. It shows where price may pause and where risk is rising. It reminds you to be patient before entering trades.
This guide explains what the hanging man pattern means. You will learn how professionals use it with other signals and why some traders make mistakes when they misread it.
What Is the Hanging Man Pattern Really Signaling?
The hanging man pattern is a single candle that shows up after an uptrend. Its real meaning is not just in its shape. What matters is the change in price behavior inside the candle.
In a strong uptrend, buyers are in control. Price moves up easily and pullbacks are small. When the hanging man appears, this balance starts to change. The shift is often small but important.
During the session:
- Sellers manage to drive price sharply lower
- Buyers recover much of that move before the close
- The uptrend remains technically intact, yet pressure builds beneath the surface
This tells an important story. Even if price closes near the top, sellers have shown new strength. Buyers had to work harder to keep the trend going. The risk is still there.
This is why experienced traders see the hanging man as a warning, not a signal to trade. It does not mean a reversal will happen. It means the trend may not be as strong as it looks.
Hanging Man Candlestick Formation Explained Visually
In candlestick trading, structure is more important than just knowing pattern names. Focus on how price moved during the session, not just how the candle looks.
A proper hanging man candlestick formation has three defining characteristics:
- A small real body positioned near the top of the candle
- A long lower shadow, usually at least twice the size of the body
- Little to no upper wick, showing limited upside expansion
The lower shadow is the most important part. It shows sellers were strong enough to push price down. This does not happen often in a healthy uptrend.
If price recovers before the close, the signal is still valid. It means buyers had to work harder to take back control. Experienced traders watch for this extra effort.
This small change, not the candle’s color or name, is what makes the pattern useful.
IIFL’s explanation of the hanging man candlestick pattern further illustrates its characteristics and bearish implications.
Hanging Man Candlestick Chart Example Most Traders Misread
On a real chart, the hanging man candle can look harmless. Price closes near the high, the trend still looks strong, and indicators may not show weakness.
This is exactly why many traders misinterpret it.
They see a strong close and think the trend will continue. They buy late, not knowing the candle shows hidden weakness.
Professional traders do the opposite. They do not just look at the close. They ask questions about the context:
- Did the candle form near a well-defined resistance level?
- Is the trend showing signs of slowing or exhaustion?
- Did selling pressure increase, particularly visible through volume during the lower wick?
These questions help traders focus on what matters most. Without context, the candle is not helpful. But in the right situation, it warns that the market may be weakening. You can find real chart examples of the hanging man pattern on TradingView.
This is what sets disciplined traders apart from those who react without a plan. You can use this pattern effectively on trading platforms like MetaTrader 4. Learn more in our MetaTrader 4 guide.
Hanging Man Reversal — When It Works and When It Fails
A hanging man candle alone does not confirm a reversal. Using it by itself is a common mistake. The candle only shows possible weakness. You need confirmation to know if the weakness is real.
Reliable confirmation usually appears in the form of:
- A bearish close on the candle that follows
- A break below the low of the hanging man
- Clear rejection from a key resistance level or supply zone
When these conditions align, the market often shifts out of strong bullish momentum and moves into:
- Sideways consolidation as buyers hesitate
- Shallow pullbacks that test support
- Or, in stronger cases, a full trend reversal
When the pattern fails, price simply continues higher. This typically happens when:
- The broader trend remains structurally strong
- No meaningful resistance exists above price
- Overall market sentiment stays decisively bullish
Knowing the difference between these situations is important for managing risk. The hanging man does not predict the future. It helps you see if risk is increasing or decreasing, so you can adjust your plan. Capital.com’s technical analysis article explains the psychology behind the hanging man pattern and how it shows weakening bullish momentum.
Bullish Hanging Man vs Reality — A Dangerous Misconception
The term ‘bullish hanging man’ can confuse new traders. They see a green candle and think it means strength.
But the pattern is not bullish. A green close only means buyers recovered for now. It does not mean the trend is strong again.
The real danger lies in these assumptions:
- A green candle automatically signals continuation
- A long lower wick means sellers were rejected
The candle shows sellers were active, even as the market moved up. Their selling was absorbed by buyers. This is often an early sign that the trend is getting tired, not stronger.
Traders who miss this warning often buy when momentum is weak and risk is rising.
Bearish Hanging Man Pattern — The Proper Interpretation
The bearish hanging man only matters when the market confirms it. Without confirmation, it is just a warning.
Experienced traders watch closely for:
- Clear follow-through selling after the pattern
- Inability of price to make new highs
- Weak or indecisive closes in subsequent candles
These signs show buyers are losing control. Professionals wait for the market to prove weakness before they act.
The candle quietly warns of risk.
Confirmation turns this warning into a signal you can use.
Hanging Man Pattern Candlestick vs Hammer — Spot the Difference Fast
The hanging man and hammer candles look almost the same. Both have small bodies and long lower shadows. The key difference is the trend they appear in, which changes what they mean.
- Hammer: Appears after a downtrend → signals potential bullish reversal
- Hanging Man: Appears after an uptrend → signals potential bearish warning
Mixing up these patterns can lead to mistakes. Experienced traders always check the trend before deciding. To learn more about the differences, read our detailed guide on hammer and inverted hammer candlesticks.
Hangman Candlestick Pattern — Why the Name Fits Perfectly
The name ‘hangman candlestick pattern’ is just a symbol. The long lower shadow looks like a hanging rope, showing how price was pulled down during the session.
Even if buyers recover and close near the high, the market has shown weakness. This candle is not the end of the uptrend. It is a warning that things may be changing and you should be careful.
How Professionals Trade the Hanging Man Pattern Safely
Professional traders treat the hanging man pattern as a contextual signal, not an automatic trade trigger. Their approach emphasizes risk management, confirmation, and probability alignment:
- Wait for bearish confirmation such as a follow-through candle or break below the low
- Enter only after structural weakness is confirmed
- Place stops above recent highs to manage risk effectively
- Adjust position size to reflect uncertainty in the market
This careful method helps traders avoid emotional trades. It makes sure decisions are based on real signals, not guesses.
Hanging Man Pattern Candlestick in Real Trading Strategies
In real trading, the hanging man works best with other signals. Using more than one clue makes it more reliable and reduces false alarms. Professionals look for:
- Major resistance levels where price historically struggles to advance
- RSI or momentum divergence, indicating weakening buying pressure
- Signs of decreasing bullish momentum, such as smaller candle bodies or lower volume
- Higher-timeframe exhaustion, showing that multiple timeframes align on potential trend weakening
On its own, the pattern does not say much. But when these signs appear together, the hanging man gives a strong early warning. It helps you plan trades and protect profits. Other patterns, like the inverse head and shoulders, can also help spot market reversals.
Key Mistakes That Make the Hanging Man Fail
Most mistakes come from how traders use the candle, not the candle itself.
- Entering trades without confirmation
- Ignoring overall market structure
- Using the pattern in strong, resilient trends
- Over-leveraging based on a single candle
Professional traders accept uncertainty and adjust their plans to fit the market. Beginners often ignore warnings and take risks they should avoid. The TradeSmart guide discusses the limitations of the hanging man pattern and explains why confirmation is essential before trading.
Is the Hanging Man Pattern Reliable in Modern Markets?
In today’s fast markets, one candle rarely causes a reversal. But the hanging man pattern is still useful. It shows when risk is rising, even if computers are trading.
It is most effective under these conditions:
- Higher timeframes, where price action reflects meaningful market behavior
- Overextended markets, after prolonged rallies
- Near historical resistance, where sellers are more likely to act
The real value is not in calling reversals. It helps you spot risk early, so you can protect your money before the trend weakens.
Final Thoughts: Why Smart Traders Respect the Hanging Man
The hanging man pattern does not predict market tops. It is a warning that the uptrend may be getting weaker.
Traders who use this pattern do not rush. They:
- Avoid chasing late entries, reducing the risk of buying into exhaustion
- Protect profits early, using the candle as a guide for stops or scaling out
- Wait for confirmation, ensuring that the market demonstrates real follow-through before committing capital
In the end, discipline is what makes traders successful, not just the candle. The hanging man is a tool to help you make better choices, not a promise of what will happen.
Disclaimer:
This article is for educational purposes only and does not constitute financial or trading advice. Candlestick patterns do not guarantee market reversals. Always use proper risk management and consult a qualified professional before trading.
FAQs
What is the hanging man pattern in candlestick trading?
The hanging man pattern is a single-candlestick formation appearing after an uptrend, warning that buying pressure may be weakening. It shows that sellers were able to push price sharply lower during the session, even though buyers recovered most of the loss before the close.
Is the hanging man pattern bullish or bearish?
The hanging man pattern is bearish by implication, not bullish. While the candle may close green, it signals potential trend exhaustion and requires bearish confirmation before being used as a trade signal.
Does the hanging man pattern always lead to a reversal?
No, It is a warning, not a guarantee. The pattern becomes meaningful only when followed by confirmation, such as a bearish close, rejection from resistance, or a break below the candle’s low.
What confirms a hanging man reversal?
Common confirmation signals include:
- A bearish candle closing below the hanging man
- Increased selling volume
- Failure to make a new high
- Confluence with resistance or momentum divergence
What is the difference between a hanging man and a hammer?
Both candles look similar, but context is crucial. A hammer forms after a downtrend and signals potential bullish reversal, whereas a hanging man appears after an uptrend and warns of possible bearish pressure.
Can beginners trade the hanging man pattern safely?
Beginners should use the pattern as a risk-awareness tool, not a standalone entry signal. Waiting for confirmation and applying proper risk management are essential to avoid false signals.
Does the hanging man pattern work in Forex and crypto markets?
Yes, The hanging man pattern appears across Forex, crypto, stocks, and indices. It is generally more reliable on higher timeframes where market noise is reduced.
Which timeframe is best for the hanging man pattern?
Higher timeframes, such as the 4-hour, daily, and weekly charts, tend to provide more reliable hanging man signals compared to very low timeframes.

4 thoughts on “Hanging Man Pattern: The Silent Signal Smart Traders Never Ignore”
Pingback: Double Top and Double Bottom The Silent Signals That Smart Traders Trust | GuriFx
Pingback: The Secret Behind Price Action Moves Sideways That Most Traders Overlook
Pingback: Bullish and Bearish Divergence: The Silent Market Signals Most Traders Never Notice
Pingback: ORB Trading Strategy: Why Smart Day Traders Trust the Opening Range