
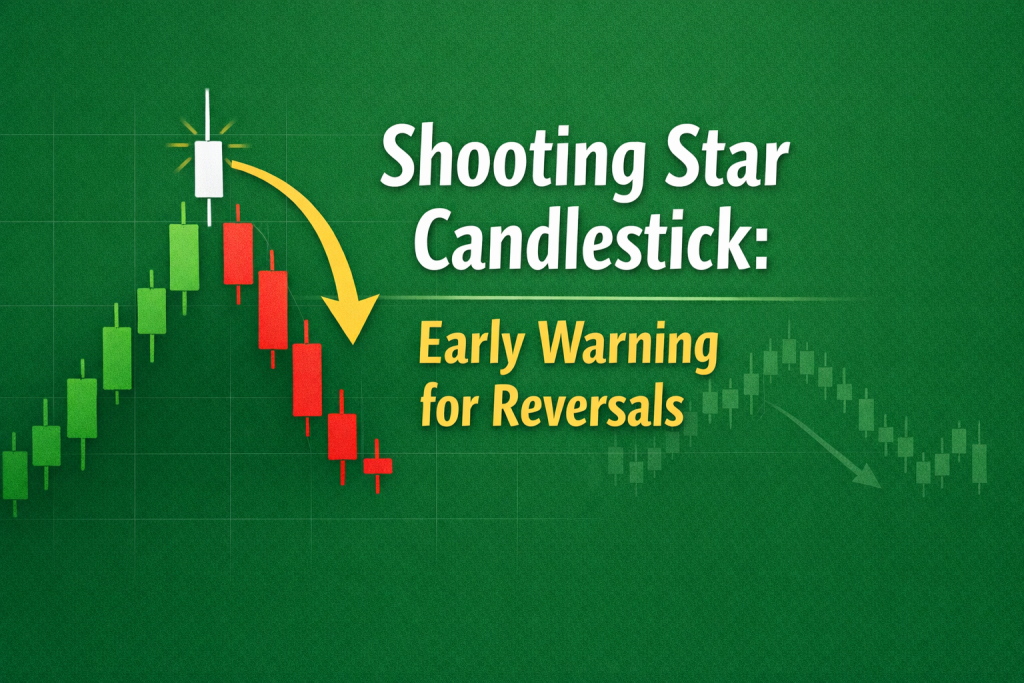
Shooting Star Candlestick: Spot Trend Exhaustion Before the Market Reverses
Most traders chase trends.
Smart traders watch for the moment those trends run out of fuel.
When prices rise quickly, buyers become confident. Then, momentum fades. Sellers enter the market, and late buyers end up stuck at the top. This shift is captured in a single candle: the shooting star.
This guide will show you how to spot, understand, and trade the shooting star pattern, especially in fast-moving Forex markets where timing matters. Whether you are new to price action or improving your strategy, you will learn to spot reversals before most traders notice them.
What Is a Shooting Star Candlestick?
At first, a shooting star might look like any other candle. But it gives a clear warning from the market.
The definition of a shooting star candlestick is simple but powerful:
It signals a bearish reversal. It forms after an uptrend and shows that buyers are losing control as sellers begin to take over.
The shape of this candle makes it easy to recognize:
- A small real body near the low of the session, showing weak bullish follow-through
- A long upper shadow, usually at least twice the size of the body, revealing aggressive price rejection
- Little or no lower shadow, confirming sellers dominated before the close
- Most importantly, it appears after a clear uptrend.
All these signs send a clear message:
Buyers drove the price up but could not hold it. Sellers then took over and brought the price back down. This signals weakness at the top.
Simply put, the shooting star candlestick is the market’s way of saying:
“The bullish push failed. The balance of power is shifting.”
Shooting Star Candlestick Meaning: The Hidden Battle Between Buyers and Sellers
To understand the shooting star, focus on the market’s behavior, not just the candle’s shape.
During an uptrend, buyers feel confident. Prices keep rising, optimism builds, and late traders jump in. But when a shooting star forms, something important shifts beneath the surface.
Here’s what the price action is really telling you:
- The market attempts another rally
Price surges higher, creating the long upper wick and pulling in breakout buyers. - Sellers quietly step in at the top
Institutions and smart money begin offloading positions into strength. - Price collapses back near the open
The candle closes near its low, exposing fading bullish momentum.
This fast shift from buyers to sellers is why the shooting star is seen as a bearish reversal signal.
It does not always mean the price will fall immediately. But it is an early warning sign:
Momentum is fading and the trend could reverse.
Noticing weakness early can help you avoid losses. It is safer than reacting after the fact.
Shooting Star vs Inverted Hammer: One Looks Bearish, the Other Isn’t
Many traders make mistakes by mixing up candles that look similar.
The shooting star and inverted hammer look very similar, but they mean the opposite. The main difference is the trend that comes before the candle forms.
Here’s how to separate them instantly:
- Shooting Star: Forms after an uptrend and warns of a potential bearish reversal
- Inverted Hammer: Forms after a downtrend and hints at possible bullish recovery
They share the same shape but signal different things.
If you trade based only on a candle’s appearance, you are just guessing. Always check where the candle forms in the trend before making a decision.
How to Identify a Valid Shooting Star Candlestick Pattern
Not every candle with a long wick matters. Many are just market noise.
A true shooting star pattern must meet certain rules. If you skip any, you could get a false signal.
Before labeling it a shooting star, confirm the following:
- Clear uptrend beforehand
The pattern only works when buyers were in control before the candle formed. - Real body positioned near the session low
This shows buyers failed to hold higher prices. - Long upper shadow
Ideally at least twice the size of the real body, signaling strong rejection. - Little to no lower shadow
Sellers dominated the close, leaving no room for bullish recovery. - Bearish confirmation afterward
A lower close on the next candle adds credibility and filters out weak setups.
When all these signs are present, you have a strong shooting star setup. This is worth paying attention to.
Shooting Star Candlestick Patterns: What They Reveal on Real Charts
A shooting star is not always strong just because it shows up.
Its strength depends on where and when it forms.
On live charts, shooting star candlestick patterns act like warning lights. They may be subtle alone, but become powerful when they appear in the right context.
Here’s how to read them like a pro:
When a Shooting Star Forms at Resistance
A shooting star appearing near a clear resistance zone carries far more weight than one in open space.
Why? Because resistance is where sellers expect the price to fail. When price rises into that area and is quickly rejected, the shooting star confirms that sellers are defending the level.
In simple terms:
Price tried to break higher but was pushed back down.
This is not random. Sellers are acting with intention.
After an Extended or Aggressive Move Up
When an uptrend has already gone far, with several bullish candles, strong momentum, and emotional buying, a shooting star often signals trend exhaustion.
At this stage:
- Late buyers are entering
- Early buyers are taking profits
- Sellers see opportunity
The shooting star appears when buyers are most excited and sellers begin to take control.
Multi-Timeframe Confirmation Makes It Stronger
Timeframe alignment is one of the most overlooked factors.
If a shooting star on a lower timeframe aligns with:
- A daily resistance level
- Or a weekly structure zone
This makes the signal much more reliable.
When higher timeframes agree, you are trading with the market structure, not just reacting to a single candle.
A shooting star is not just about the candle.
It depends on where it forms, the momentum, and the context. These factors make it a strong setup.
Step-by-Step: How to Trade the Shooting Star Pattern Like a Pro
Catching a reversal with a shooting star candlestick is not about speed. It requires patience, context, and discipline. Here is a step-by-step approach that successful traders use:
Step 1: Confirm the Trend
Never trade a shooting star in isolation.
Make sure it forms after clear upward momentum. The pattern only works as a bearish reversal signal if buyers were in control before. Think of it as spotting trend exhaustion, not just guessing a drop.
Step 2: Wait for Confirmation
A shooting star signals potential weakness, but it doesn’t guarantee it.
Watch the next candle closely. If it closes below the shooting star’s low, you have confirmation that sellers are stepping in. Waiting for this helps reduce false signals and protects your capital.
Step 3: Entry Strategy
Once confirmation is visible, it’s time to act:
- Enter short (sell) either as price breaks below the shooting star’s low
- Or after the confirmation candle closes for a safer entry
This way, you trade based on evidence, not just a guess.
Step 4: Set Your Stop-Loss
Always manage your risk. Place your stop-loss just above the high of the shooting star.
This protects you if the market moves up again.
Step 5: Determine Your Take-Profit
Targets can vary based on strategy:
- The next support level is the simplest approach
- You can also use tools like RSI, volume, or Fibonacci levels to set your exit.
The goal is to stay patient and manage your risk.
Shooting Star Candlestick in Forex: Best Practices
The forex market has its own dynamics. So, how do you use the shooting star candlestick forex strategy?
Choose the Right Pairs
Look for major and liquid pairs where technical patterns follow market structure. Use resources like lists of the best currency pairs to trade now to match your pattern trades with pairs that have good volatility and spreads.
Time Frames Matter
Daily and 4-hour candles usually give more reliable signals than 5-minute or 15-minute charts in forex.
Combine with Support & Resistance
Wait for a shooting star to form at a known supply zone or resistance for better accuracy.
Avoid Ranging Markets
A shooting star in a sideways market often means little unless it lines up with structural swing highs.
Common Mistakes Traders Make With Shooting Stars
Even reliable patterns can fail if used incorrectly. Here are some common mistakes:
1. Trading Without Trend Confirmation
If the prior trend isn’t clearly upward, the signal loses meaning.
2. Ignoring Volume
Low volume signals weaker conviction and increases the chance of false reversals.
3. Ignoring Confluence
Treat the candlestick as one piece of evidence, not the only factor.
4. Emotional Trading
Jumping in after spotting a pattern, without waiting for confirmation, often leads to losses.
Shooting Stars Candlestick vs Other Patterns
If you are serious about price action trading, you will see many patterns. Let’s compare a few:
Shooting Star vs Bearish Engulfing
- Shooting Star: a single candle reversal
- Bearish Engulfing: two candles, often a stronger signal
Shooting Star vs Rising Wedge
A rising wedge is a multi-bar pattern indicating weakening trend before reversal. Incorporate that into your analysis alongside shooting stars for stronger setups.
Both patterns show trend exhaustion, but the wedge gives more structure while the shooting star offers precise entries.
When Not to Trade a Shooting Star
Smart trading is about more than just spotting patterns. Avoid trading shooting stars when:
- Price is in a strong structural uptrend with consistent bullish momentum
- There’s no resistance nearby
- The candle barely qualifies (short wick, ambiguous body)
In these situations, the pattern fails more often than it works.
Advanced Tips: Boosting Shooting Star Accuracy
Here are some ways professional traders improve their results:
1. Use Indicators
Combine the shooting star with RSI overbought signals or MACD bearish divergence to confirm a shift in momentum.
2. Multi-Timeframe Confirmation
A shooting star on a daily chart that lines up with a weekly resistance zone has a higher chance of working.
3. Volume Analysis
A long upper wick on high volume shows strong rejection of higher prices.
4. Trade confluence with patterns
For example, a shooting star near a wedge breakout makes the bearish case stronger.
Before You Trade a Shooting Star Candlestick, Ask Yourself This
Not every candle with a long wick is a warning.
Many traders lose money because they think they have found a shooting star without asking the right questions.
Before you make any trade, pause and question the candle in front of you:
- Was the market clearly moving up before this candle appeared?
- A shooting star only makes sense after buyers have been in control.
- Did price close near the low, leaving behind a small real body?
- This is the point where bullish confidence begins to weaken.
- Did price shoot higher and get aggressively rejected?
- That long upper wick is the market’s way of saying, “Higher prices were not accepted.”
- Is the lower wick minimal or nearly absent?
- This shows sellers stepped in strongly before the candle closed.
- Did the next candle confirm weakness?
- Smart traders wait for proof, not hope.
If most of your answers are “yes,” you are not guessing. You are seeing a real shooting star candlestick setup.
That simple pause can be the difference between catching a reversal early or getting stuck at the top.
Common Myths About Shooting Star Candlesticks
Myth #1: It Always Signals a Trend Reversal
No, sometimes it just leads to a pullback. Always look for confluence.
Myth #2: Color Matters
Red or green? The color does not matter as much. The body position and wick length are more important.
Myth #3: Only Works in Stocks
It works in currencies, commodities, and indices—anywhere price action is used.
Real Trading Examples: What You’d See on Charts
Imagine you are watching the EUR/USD daily chart. Price has rallied, but then a long upper wick appears with a small body and no lower shadow. That is your shooting star candlestick pattern. If the next candle closes lower, it confirms bearish pressure.
This is when you set your sell entry just below the low of that pattern, with your stop just above the high. It is simple and structured.
Final Thoughts: Mastering the Shooting Star Candlestick
The shooting star candlestick is powerful because it is visual, simple, and based on psychology. But like all candlestick analysis, it is not magic. The key to success is:
- Context
- Confirmation
- Risk management
- Confluence with other tools and patterns
When used correctly, especially with structural insights like resistance levels or patterns such as rising wedges, it becomes a reliable tool in your trading toolkit.
Master the shooting star candlestick pattern and respect market structure, and you will see clearer reversal signals that many traders miss.
FAQs About Shooting Star Candlestick
What is a shooting star candlestick in trading?
A shooting star candlestick is a bearish reversal signal that appears after an uptrend, showing buyers losing control and sellers stepping in.
How can I tell the difference between a shooting star and an inverted hammer?
Look at the trend! A shooting star appears after an uptrend (bearish signal), while an inverted hammer forms after a downtrend (bullish signal).
What does a shooting star candlestick mean in price action?
It signals momentum is weakening. The long upper wick shows buyers tried to push higher but were overpowered by sellers.
How do I trade the shooting star pattern safely?
Wait for confirmation—a bearish candle after the shooting star—then enter short with a stop above the wick and take profit at the next support level.
Are shooting star candlestick patterns reliable in Forex?
Yes, especially on higher timeframes or when aligned with resistance zones, but always confirm with trend context and multi-timeframe analysis.
Can multiple shooting stars appear in a row?
Absolutely! Multiple shooting stars at the same resistance or after a strong uptrend increase the probability of a trend reversal.
2 thoughts on “Shooting Star Candlestick: Early Warning for Reversals”
Pingback: Bullish Harami & Bearish Harami How Smart Traders Spot Early Reversals
Pingback: Hammer & Inverted Hammer Candlestick: The Reversal Clue Hidden Inside These Candles