
Rising Wedge Pattern Explained: How to Identify, Trade, and Profit
Introduction: What Is a Rising Wedge Pattern?
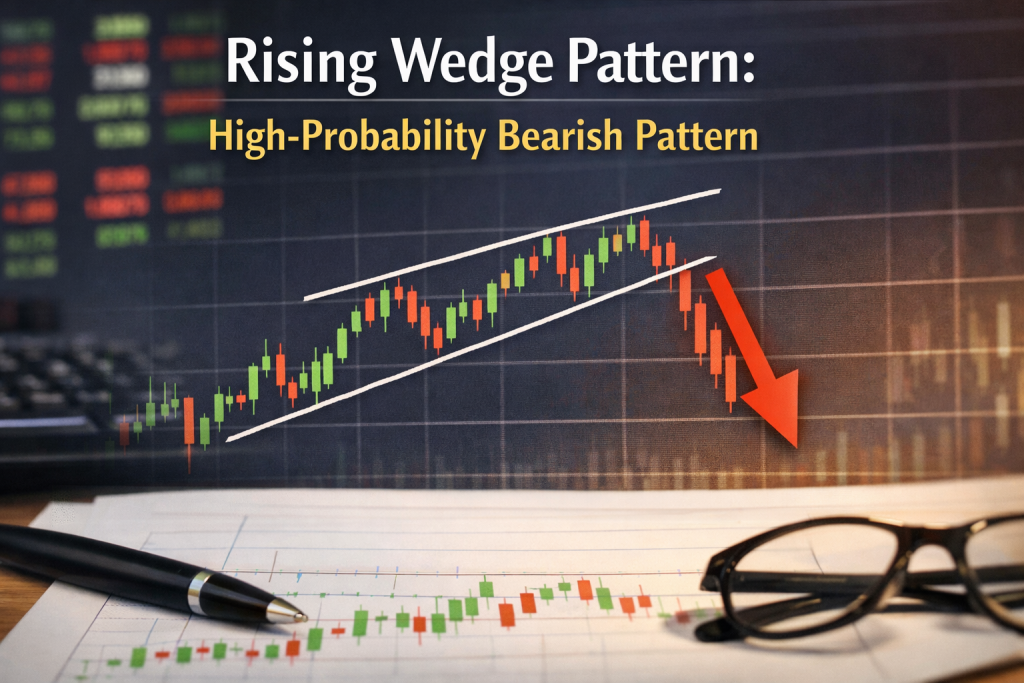
The rising wedge is a key chart pattern for traders in forex, crypto, and stocks. Even though prices look like they are going up, this pattern usually warns that buyers are losing strength and a reversal could be coming.
Many new traders think rising prices always mean strength. But when prices go up in a narrowing range, it often means buyers are losing control. This is what the rising wedge pattern shows.
In this guide, you will learn how to spot a rising wedge, know if it is bullish or bearish, and trade it with confidence using simple steps.
What Is a Rising Wedge Pattern in Technical Analysis?
A rising wedge forms when price moves up between two lines that get closer together. Both highs and lows go up, but the lows rise faster. This makes the range tighter.
This pattern means buyers are still in the market, but each new high is weaker. It is a sign that buyers are losing momentum. Most of the time, a rising wedge points to a bearish reversal.
Key Definition
A rising wedge is a bearish pattern. It can form in an uptrend or downtrend and often leads to a drop in price.
It is commonly used in:
- Forex trading
- Crypto trading
- Stock market technical analysis
Is the Rising Wedge Pattern Bullish or Bearish?
The rising wedge is usually a bearish pattern. While the rising wedge is usually bearish, traders should also understand when market conditions shift from bearish to bullish, which we explain in detail in our guide on When Does a Bearish Market Become Bullish in Forex?
Why Is It Bearish?
- Price continues to rise, but momentum weakens
- Buyers lose strength while sellers gradually step in
- Volume usually declines as the wedge forms
- A breakdown below the lower trendline often follows
Market Psychology Behind the Pattern
At first, buyers dominate the market. However, as price moves higher:
- New buyers hesitate to enter
- Early buyers start taking profits
- Sellers gain confidence
This change in mindset often leads to a bearish breakout. That is why the rising wedge is a strong reversal signal.
Key Characteristics of a Rising Wedge Pattern
To spot a rising wedge, check for these signs:
1. Higher Highs and Higher Lows
Price continues to make higher highs and higher lows, indicating an apparent uptrend.
2. Converging Trendlines
- Upper trendline rises slowly
- Lower trendline rises faster
- The price range narrows over time
3. Decreasing Volume
Volume usually drops as the pattern forms. This means buyers are less interested.
4. Breakdown Direction
The breakout usually happens below the lower trendline.
How to Identify a Rising Wedge Pattern on Charts
Spotting the rising wedge correctly helps you avoid false signals.
Step-by-Step Identification Guide
- Identify an existing uptrend or retracement
- Draw an upper trendline connecting higher highs
- Draw a lower trendline connecting higher lows
- Ensure both lines converge
- Watch for declining volume
- Wait for a confirmed breakdown
Common Mistakes Traders Make
- Confusing a rising wedge with an ascending channel
- Entering trades before confirmation
- Ignoring volume and indicators
Rising Wedge Pattern vs Falling Wedge Pattern
Many traders often mix up the rising wedge with the falling wedge, especially when they’re just getting started with chart patterns. According to IG’s trading guide, a rising wedge usually points to fading bullish strength and often warns of a possible downside breakout across different markets, including forex and stocks.
Rising Wedge Pattern
- Direction: Upward
- Bias: Bearish
- Breakout: Downward
Falling Wedge Pattern
- Direction: Downward
- Bias: Bullish
- Breakout: Upward
Key Difference:
A rising wedge signals trend weakness, while a falling wedge signals trend recovery.
Rising Wedge Pattern Breakout: What to Expect
The key moment in a rising wedge is the breakout.
Breakdown Confirmation Signals
- Strong bearish candle closing below the lower trendline
- Increase in volume during breakdown
- RSI or MACD turning bearish
False Breakouts
Sometimes price breaks the trendline but then moves back inside the wedge. To avoid getting caught by these false breakouts:
- Wait for candle close
- Use higher timeframes
- Combine with indicators
How to Trade the Rising Wedge Pattern (Step-by-Step)
1. Entry Strategy
- Conservative entry: After confirmed breakdown
- Aggressive entry: Near resistance with bearish confirmation
2. Stop-Loss Placement
- Above the recent swing high
- Above the upper trendline
3. Take-Profit Targets
- Measure the height of the wedge
- Project the same distance downward from the breakout point
4. Risk-Reward Ratio
Aim for at least a 1:2 risk-reward ratio. This helps you stay profitable over time. Even the best chart patterns can fail, which is why proper position sizing, stop-loss placement, and discipline are critical, as explained in our guide on Smart Risk Management in Forex: Save Your Hard-Earned Cash.
Best Indicators to Use with Rising Wedge Pattern
Using indicators makes your trades more accurate.
RSI (Relative Strength Index)
- Look for bearish divergence
- RSI below 50 confirms weakness
MACD
- Bearish crossover strengthens breakdown signal
Volume Indicator
- Declining volume during formation
- Rising volume during breakdown
Rising Wedge Pattern in Forex Trading
The rising wedge works well in forex because:
- Strong trends
- High liquidity
- Clear price action
Popular Forex Pairs
- EUR/USD
- GBP/USD
- USD/JPY
Forex traders use this pattern during corrections before a big move down.
Rising Wedge Pattern in Crypto and Stock Markets
Crypto Market
- Higher volatility
- Faster breakouts
- Requires tighter risk management
Stock Market
- Works well on daily and weekly charts
- Often appears near market tops
The core concept remains the same across all markets.
Common Mistakes Traders Make with Rising Wedge Pattern
- Entering before confirmation
- Ignoring volume behavior
- Overtrading small timeframes
- Not using stop-loss
Avoiding these mistakes significantly improves success rate.
Pros and Cons of Trading the Rising Wedge Pattern
Pros
- Clear structure
- High probability setup
- Defined risk and reward
Cons
- False breakouts possible
- Needs confirmation
- Not effective in ranging markets
Real Example of a Rising Wedge Pattern
Picture this: price makes higher highs and higher lows on a 4H chart. Volume drops, RSI shows weakness, and price breaks below the lower trendline with a strong bearish candle. This is a classic rising wedge breakdown and a great chance for a short trade.
Final Thoughts: Should You Trade the Rising Wedge Pattern?
The rising wedge is a strong bearish signal if you use it right. It helps you spot weak trends, plan good trades, and manage risk. But do not trade it alone.
For best results:
- Combine it with indicators
- Wait for confirmation
- Follow strict risk management
If you use it with discipline, the rising wedge can be a valuable tool in your trading strategy.
Disclaimer:
This content is for educational purposes only and does not constitute financial or trading advice. Chart patterns like the rising wedge indicate probability, not certainty. Always wait for confirmation, use proper risk management, and consult a qualified professional before trading.
Frequently Asked Questions
Is a rising wedge pattern always bearish?
No, but it is bearish in most cases. Confirmation through volume and indicators is essential.
Does the rising wedge pattern work on all timeframes?
Yes, but it works best on higher timeframes like H1, H4, and Daily charts.
Can a rising wedge pattern fail?
Yes, false breakouts can occur, especially in low-volume conditions.
Is the rising wedge pattern good for beginners?
Yes, because it offers a clear structure and defined risk management rules.
What confirms a rising wedge breakdown?
A strong candle close below the lower trendline with increased volume.

3 thoughts on “Rising Wedge Pattern: High-Probability Bearish Pattern”
Pingback: Shooting Star Candlestick: Early Warning for Reversals
Pingback: Inverse Head and Shoulders Pattern Why This Quiet Setup Starts Strong Trends | GuriFx
Pingback: Best Currency Pairs to Trade Right Now at Current Time